Seputeh
Price coverage of 227 items at 11 locations in the Seputeh district.
Item List
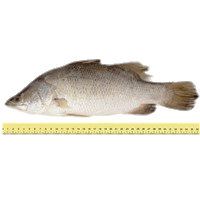
barramundi (2-4 per kg)
RM 32.90 /1kg BAHAN LAUT
dried squid (medium size)
RM 183.75 /1kg HASIL LAUT KERING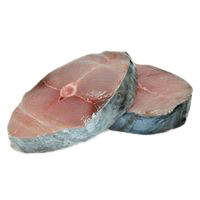
Spanish mackerel (batang, slices)
RM 73.95 /1kg BAHAN LAUT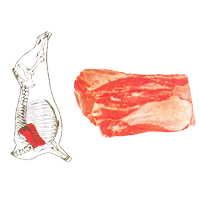
imported beef (blade)
RM 23.99 /1kg DAGING
green bird's eye chilli
RM 39.90 /1kg SAYUR-SAYURAN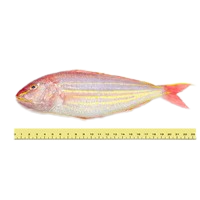
threadfin bream (5-10 per kg)
RM 21.80 /1kg BAHAN LAUT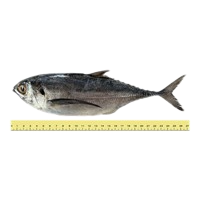
hardtail scad (4-6 per kg)
RM 14.47 /1kg BAHAN LAUT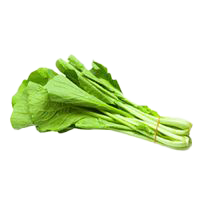
green mustard greens
RM 10.95 /1kg SAYUR-SAYURAN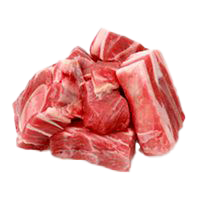
imported bone-in mutton (Australia, boxed)
RM 48.90 /1kg DAGING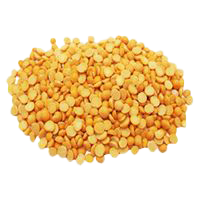
dhal (Australia)
RM 6.97 /1kg KACANG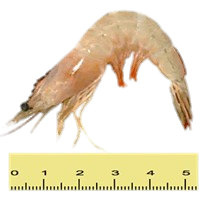
small white prawn (>=61 per kg)
RM 24.99 /1kg BAHAN LAUT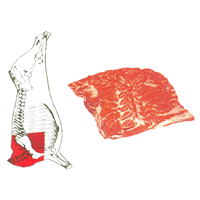
imported buffalo meat (India, chuck)
RM 34.90 /1kg DAGINGBiggest Savings in Seputeh
 ECONSAVE CASH AND CARRY ( SCOTT GARDEN ) Seputeh·W.P. Kuala Lumpur 125 barang −14.5% vs district average
 NSK TRADE CITY ( KUCHAI LAMA ) Seputeh·W.P. Kuala Lumpur 170 barang −12.6% vs district average PASAR JALAN KLANG LAMA Seputeh·W.P. Kuala Lumpur 39 barang −12.2% vs district average MEMA'S GROCER SRI PETALING Seputeh·W.P. Kuala Lumpur 83 barang −10.7% vs district average HARIZA TRADING Seputeh·W.P. Kuala Lumpur 30 barang −3.0% vs district average
 THE STORE ( SRI PETALING ) Seputeh·W.P. Kuala Lumpur 154 barang −3.9% vs district average KEDAI RUNCIT MRT MAJU TRADING (MRT 1) Seputeh·W.P. Kuala Lumpur 23 barang −4.5% vs district average
 GIANT MINI (JUTARIA GEMILANG SDN BHD) Seputeh·W.P. Kuala Lumpur 70 barang −5.9% vs district average
 BEN'S INDEPENDENT GROCER ( B.I.G ) Seputeh·W.P. Kuala Lumpur 126 barang −8.6% vs district average PASAR MINI FAA Seputeh·W.P. Kuala Lumpur 17 barang −8.6% vs district average
Stores selling items below the Seputeh district average, sorted by the widest gap.
The Seputeh district in W.P. Kuala Lumpur has 11 locations tracking 227 items for the week of 2 November 2026. On average, prices in Seputeh are 4.3% higher than the national average.
Prices in Seputeh are on par with the W.P. Kuala Lumpur average.
Urban area · main chains: NSK, THE STORE, JAYA GROCER.
By Category Group
% Difference from the District Average — Chain × Category Group
| B.I.G | +4.3% | +13% | +9.4% | +16% | +6.4% | +7.1% |
|---|---|---|---|---|---|---|
| ECONSAVE | −8.1% | −21% | −9.5% | −24% | −5.4% | −10% |
| GIANT | +4.6% | +5.4% | +14% | +7.2% | +0.7% | +5.3% |
| INDIE | +2.3% | +2.6% | −2.2% | +15% | +0.7% | +2% |
| JAYA GROCER | +1.9% | +19% | +1.8% | +14% | +2.9% | −1.9% |
| NSK | −5.6% | −21% | −8.6% | −24% | −5% | −4.5% |
| THE STORE | −0.7% | +12% | +0.7% | −1.1% | +3.4% | +2.2% |
Each cell: the average percentage difference of every item in that group at that chain against the district average for the same item. Chains with the most locations are listed first.
% Difference from the District Average — Store Type × Category Group
| Grocery Store | +4.3% | +6.2% | ||||
|---|---|---|---|---|---|---|
| Minimart | +3.5% | +12% | +3.8% | +7% | ||
| Supermarket | −0.5% | +1.4% | 0% | −1.2% | 0% | −0.2% |
| Wet Market | −17% | +13% |
Each cell: the average percentage difference of every item in that group at that store type against the district average for the same item. The 8 store types with the most locations are shown.
vs National is computed as the average percentage difference of each item, so it is not skewed by differing item mixes across chains or store types. vs State Average compares each item against the state average price for the same item. The cheapest-store list uses the district average price reference for each item.