Grocery Categories
Weekly trend and coverage of 6 grocery category groups nationwide.
6 grocery category groups in Malaysia covering 279 tracked items for the week of 16 November 2026.
Overall, prices rose +1.5% this week versus the week before.
Biggest moves: Dry Goods up +2.0%.
By Group
Sorted from the largest weekly drop to the biggest rise
Items by group
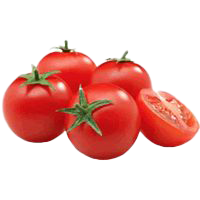 RM 7.31/1kg tomatoFruits +14.4%
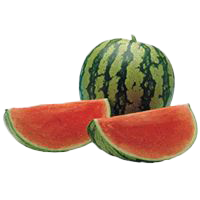 RM 4.18/1kg red watermelon (seedless)Eggs −5.6%
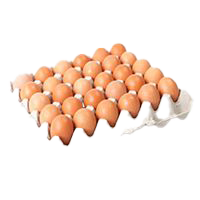 RM 13.17/30 biji chicken egg, grade cSeafood +4.5%
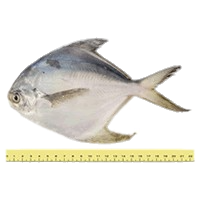 RM 50.32/1kg white pomfret (2-5 per kg)
Vegetables· Fruits· Eggs· Seafood· Coconut· Chicken· Meat· Freshwater Fish· Noodles (Mee / Kuey Teow)
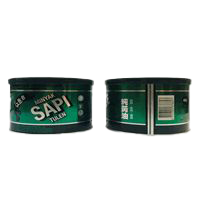 RM 34.53/400 g ghee (qbb)Rice −2.7%
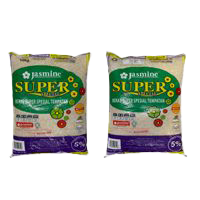 RM 25.45/10 kg rice, jasmine brand (5%)Butter and Margarine +1.1%
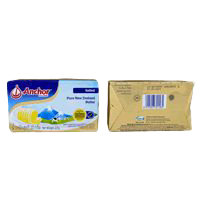 RM 15.38/227g anchor salted butterSpices (Packaged) +1.0%
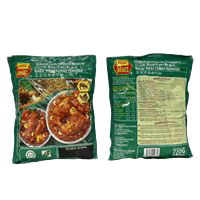 RM 6.30/250 g babas meat curry powder
Cooking Oil and Fats· Rice· Butter and Margarine· Spices (Packaged)· Rice Vermicelli· Spreads· Canned Fish· Coconut Milk (UHT / Boxed)· Flour· Creamer and Powdered Milk· Instant Noodles· Sugar· Spices (Loose)· Soy Sauce and Condiments
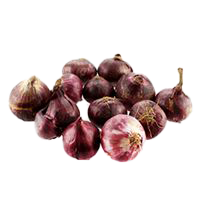 RM 7.28/1kg imported rose shallot (india)Potatoes +5.2%
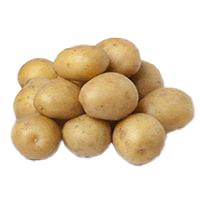 RM 3.28/1kg imported potato (china)Nuts and Pulses +1.4%
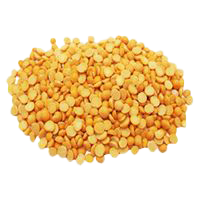 RM 4.96/1kg dhal (australia)Dried Chilli −1.2%
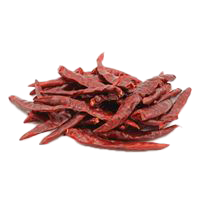 RM 22.79/1kg dried flat chilli (with/without stalk)
Onions· Potatoes· Nuts and Pulses· Dried Chilli· Dried Seafood
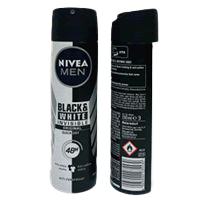 RM 19.23/150 ml nivea men deodorant (black & white invisible, original)Household Care +2.0%
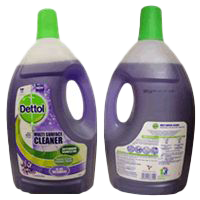 RM 23.89/2.5 liter dettol multi-purpose cleaner (lavender)Personal Care +2.2%
 RM 20.01/150 ml nivea deodorant (extra brightening)Household Care −0.8%
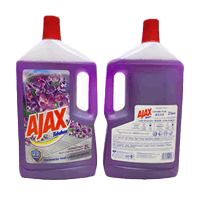 RM 14.63/2 liter ajax fabuloso multi-purpose cleaner (lavender)


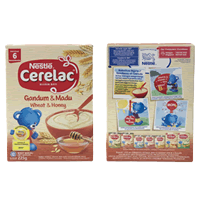
A representative sample from each group — the largest weekly moves first. Click an item to find the cheapest stores, or a category for the full list.
State × Group — weekly trend
| Johor | 0% | +1.2% | ||||
|---|---|---|---|---|---|---|
| Kedah | −0.2% | +2.1% | ||||
| Kelantan | +1.3% | +2.5% | ||||
| Melaka | +0.4% | +0.6% | ||||
| Negeri Sembilan | +1% | +2% | ||||
| Pahang | +1% | +2.2% | ||||
| Perak | +0.2% | +1.3% | ||||
| Perlis | +0.4% | +1.4% | ||||
| Pulau Pinang | 0% | +1.2% | ||||
| Sabah | +0.7% | +2.4% | ||||
| Sarawak | −0.2% | +3.2% | ||||
| Selangor | +0.7% | +2.6% | ||||
| Terengganu | +1% | +1.1% | ||||
| W.P. Kuala Lumpur | +1% | +2.6% | ||||
| W.P. Labuan | +1.2% | +1.4% | ||||
| W.P. Putrajaya | +0.6% | +2.9% |
Each cell: the change in that group's average price in that state versus last week. Green = down, red = up.
State × Group — difference from national average
| Johor | −1.7% | −0.9% | −3% | +0.3% | −0.1% | 0% |
|---|---|---|---|---|---|---|
| Kedah | −4.4% | −1.8% | −7% | −4.3% | −4.3% | −1.6% |
| Kelantan | −6.2% | +1.3% | −3.2% | −1% | −0.5% | −0.3% |
| Melaka | −5.1% | −2.8% | −3.9% | −6.1% | −3.1% | −1.3% |
| Negeri Sembilan | −3.4% | −2.2% | +0.3% | −2.4% | −3.4% | −1% |
| Pahang | −1.9% | −0.8% | −3.9% | 0% | −0.1% | −1.5% |
| Perak | −3.6% | −2.8% | +0.1% | −4.6% | −1.1% | −2% |
| Perlis | −2.3% | +0.3% | +2.1% | −3.6% | −3.7% | −0.1% |
| Pulau Pinang | −2.2% | −2.6% | +0.5% | −2.8% | −2.2% | −1.6% |
| Sabah | +3.6% | +4.5% | +2.3% | +3.7% | +2.4% | +2.8% |
| Sarawak | +5.1% | +4% | +9% | +4% | +0.1% | +0.6% |
| Selangor | +2.2% | −2.1% | −3% | −1.7% | +1.4% | −0.5% |
| Terengganu | −3% | −0.1% | +1.8% | +1.8% | +1.4% | 0% |
| W.P. Kuala Lumpur | +7.2% | +1.1% | +7.9% | +4.2% | +5.3% | +2.8% |
| W.P. Labuan | +8.1% | +6.9% | −0.5% | +3.8% | +0.4% | +1.3% |
| W.P. Putrajaya | +8.5% | +1.3% | +14% | +2.6% | +0.3% | +0.4% |
Each cell: the average percentage difference of that group's items in that state versus the national price. Green = lower, red = higher.
Store Type × Group — difference from national average
| Pasar Raya / Supermarket | 678 | −1.5% | +0.1% | −5.6% | +0.4% | +0.2% | −0.3% |
|---|---|---|---|---|---|---|---|
| Pasar Mini | 582 | −0.4% | +0.5% | +1.3% | +3.2% | −3.1% | 0% |
| Kedai Runcit | 343 | +3.1% | +2% | +5.2% | +3.1% | +0.2% | +2.4% |
| Pasar Basah | 305 | +1.7% | +2% | +13% | +0.9% | ||
| Hypermarket | 148 | −2.5% | −2.4% | −8.9% | −2.5% | −0.4% | −1.6% |
Each cell: the average percentage difference of items at that store type (e.g. Supermarket, Wet Market, Hypermarket) versus the national price. Store types with the most locations are listed first.
A group-level average price is not shown because mixing different item types (e.g. rice, cooking oil, flour) into one mean is meaningless. The most informative columns are the number of items tracked, the number of stores selling them, and the weekly trend — shown as Up, Down or Flat.