Beverage Ingredients
Weekly trend and coverage of 3 items across 3 subcategories in 16 states.
Item List
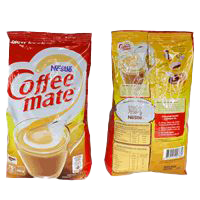
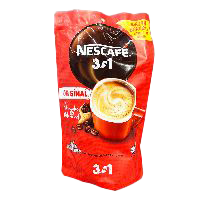
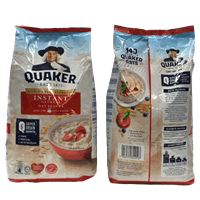
By Subcategory
Sorted from the largest weekly drop to the biggest rise
Best Value for Beverage Ingredients
 ECONSAVE SENAI Johor Bahru·Johor 2 barang −17.4% vs kebangsaan ECONSAVE SERI ISKANDAR Perak Tengah·Perak 2 barang −17.4% vs kebangsaan
 LOTUS'S KOTA BHARU Kota Bharu·Kelantan 2 barang −15.7% vs kebangsaan ECONSAVE CASH & CARRY (BH) SDN BHD. BAHAU Bahau·Negeri Sembilan 2 barang −15.1% vs kebangsaan ECONSAVE CASH AND CARRY ( SCOTT GARDEN ) Seputeh·W.P. Kuala Lumpur 2 barang −15.1% vs kebangsaan ECONSAVE CASH AND CARRY (BLG) SDN. BHD. Baling·Kedah 2 barang −15.1% vs kebangsaan
 CHECKERS CASH & CARRY ( TMN SRI SENTOSA ) Lembah Pantai·W.P. Kuala Lumpur 2 barang −14.0% vs kebangsaan LOTUS'S BAGAN AJAM Seberang Perai Utara·Pulau Pinang 3 barang −13.9% vs kebangsaan LOTUS'S CHERAS Cheras·W.P. Kuala Lumpur 2 barang −13.9% vs kebangsaan LOTUSS STORE (TESCO JITRA) Kubang Pasu·Kedah 2 barang −13.9% vs kebangsaan
Stores selling this category’s items below the national average, sorted by the largest gap.
Latest Beverage Ingredients prices in Malaysia (Beverages): 3 types tracked across 16 states for the week of 16 November 2026. Pulau Pinang has the lowest prices (−6.7% vs national).
Cheapest in Pulau Pinang (−6.7% vs national); most expensive in Sabah (+10.0%).
Main subcategories: Creamer (1), Quaker Oats (1), Nescafé (Instant Coffee) (1).
Weekly Trend — State × Subcategory
Each cell: the change in that subcategory’s average price in that state versus last week. Green = down, red = up.
% Difference from National Average — State × Subcategory
| Johor | −0.3% | −1.6% | −5.6% |
|---|---|---|---|
| Kedah | −0.8% | −5.4% | −6.3% |
| Kelantan | +2.9% | −4.4% | |
| Melaka | +0.4% | −1.9% | −9.5% |
| Negeri Sembilan | −1.3% | +8.9% | −8.8% |
| Pahang | +0.4% | +0.1% | |
| Perak | −1.2% | −3% | −8.3% |
| Perlis | +3.9% | +3.6% | |
| Pulau Pinang | −3.6% | −5.6% | −11% |
| Sabah | 0% | +22% | +8.4% |
| Sarawak | +0.9% | +11% | |
| Selangor | −1.9% | −2.6% | −6.5% |
| Terengganu | +2.2% | +6.8% | −2.2% |
| W.P. Kuala Lumpur | +1.1% | +3.8% | +6.4% |
| W.P. Labuan | −3.2% | +9.3% | |
| W.P. Putrajaya | −0.6% | −2.5% | +2.9% |
Each cell: the average percentage difference of every item in that subcategory in that state versus the national price. Green = lower, red = higher.
% Difference from National Average — Store Type × Subcategory
| Grocery Store | +6.3% | +5.3% | |
|---|---|---|---|
| Hypermarket | −2.4% | −2.1% | −7.7% |
| Minimart | +1.3% | +7.5% | |
| Supermarket | +0.6% | +5.7% | +1.4% |
Each cell: the average percentage difference of every item in that subcategory at that store type versus the national price. Store types with the most locations are listed first.
vs National is computed as the average per-item percentage difference, so it is not skewed by the differing mix of items across states or store types. The matrix above shows the first 8 subcategories by item count; other subcategories are available in the Subcategories grid above.