Selangor
Price coverage of 248 items at 126 locations across 10 districts.
Item List
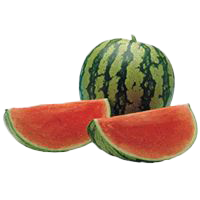
red watermelon (seedless)
RM 6.30 /1kg BUAH-BUAHAN
dried squid (medium size)
RM 61.65 /1kg HASIL LAUT KERING▼ RM 1.40
red watermelon (seeded)
RM 6.30 /1kg BUAH-BUAHAN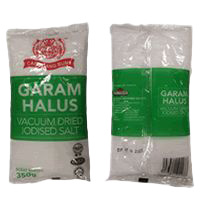
fine table salt (regular, various brands)
RM 0.76 /+-350g REMPAH RATUS (BERBUNGKUS)▲ RM 1.00
red dragon fruit
RM 13.90 /1kg BUAH-BUAHAN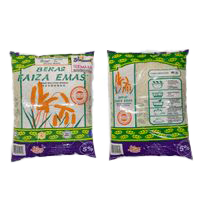
rice, Faiza Emas brand (5%)
RM 32.90 /10 kg BERAS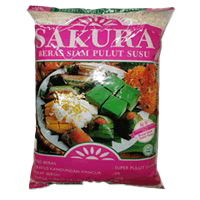
Thai glutinous rice, susu grade (various brands)
RM 6.20 /1kg BERAS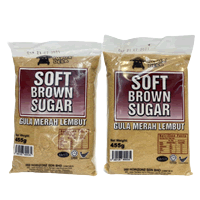
soft brown sugar (various brands)
RM 2.73 /+- 500g GULA▼ RM 0.15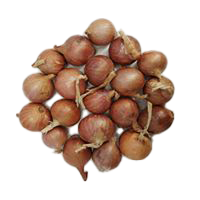
imported red shallot (Myanmar)
RM 4.35 /1kg BAWANG▼ RM 1.70
honeydew melon
RM 6.80 /1kg BUAH-BUAHAN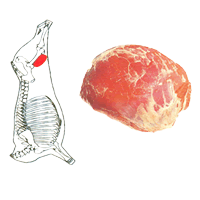
imported beef (knuckle)
RM 63.90 /1kg DAGING▲ RM 0.66
Indian mackerel (8-12 per kg)
RM 19.63 /1kg BAHAN LAUTBy District
Sorted from cheapest to priciest against the state average
Biggest Savings in Selangor
 PASARAYA ECONSAVE KAPAR SDN BHD Klang·Selangor 154 barang −12.7% vs state average PASAR AYAM DATO Petaling Jaya·Selangor 62 barang −12.7% vs state average ECONSAVE KUALA SELANGOR Kuala Selangor·Selangor 153 barang −12.5% vs state average ECONSAVE KIPMALL Sepang·Selangor 155 barang −12.1% vs state average ECONSAVE JALAN REKO Hulu Langat·Selangor 153 barang −12.0% vs state average ECONSAVE CASH & CARRY SDN. BHD. (BATANG KALI) Hulu Selangor·Selangor 158 barang −10.9% vs state average ECONSAVE KOTA KEMUNING Petaling·Selangor 169 barang −10.8% vs state average
 LOTUS'S KUALA SELANGOR Kuala Selangor·Selangor 146 barang −10.8% vs state average LOTUS'S BUKIT TINGGI Klang·Selangor 164 barang −10.6% vs state average LOTUS'S EXTRA ARA DAMANSARA Petaling Jaya·Selangor 156 barang −10.3% vs state average
Stores selling items below the state average, sorted by the widest gap.
Selangor tracks 248 items at 126 locations across 10 districts for the week of 2 November 2026. On average, prices in this state are on par with the national average.
Cheapest in Kuala Langat (−5.7% vs the state average); most expensive in Petaling (+1.8%).
Main groups: Fresh Produce (97), Packaged Goods (85), Dry Goods (18).
By Category Group
% Difference from the State Average — District × Category Group
| Gombak | +0.2% | −0.9% | −5.4% | −3.7% | 0% | −1.9% |
|---|---|---|---|---|---|---|
| Hulu Langat | −2.1% | +1.8% | −2.7% | −7% | −2.9% | −3% |
| Hulu Selangor | −2.3% | +0.9% | −1.7% | −16% | −1.7% | −2.9% |
| Klang | −2.2% | −7.5% | −4.1% | +1.5% | −0.3% | −1.9% |
| Kuala Langat | −1% | −7.2% | −14% | −14% | −8.4% | −0.3% |
| Kuala Selangor | −2.4% | −4.3% | −3.7% | −8.1% | −3.1% | −1.8% |
| Petaling | +1.5% | +2% | +4.4% | +1.7% | +0.7% | +1.3% |
| Petaling Jaya | +1% | −1.9% | −1.4% | +6.2% | +2.9% | +3.3% |
| Sabak Bernam | +0.2% | +3.6% | +6.1% | +2.1% | +0.7% | −3.3% |
| Sepang | −1.8% | +4.3% | +1.2% | +0.3% | −0.4% | 0% |
Each cell: the average percentage difference of every item in that group in that district against the state price for the same item.
% Difference from the State Average — District × Urbanisation
| Gombak | −1% | ||
|---|---|---|---|
| Hulu Langat | −1.3% | ||
| Hulu Selangor | −1.9% | ||
| Klang | −3.8% | ||
| Kuala Langat | −5.7% | ||
| Kuala Selangor | −3.6% | ||
| Petaling | +1.8% | ||
| Petaling Jaya | +0.4% | ||
| Sabak Bernam | +1.7% | ||
| Sepang | +1% |
Each cell: the average percentage difference of prices in the Urban / Suburban / Rural parts of that district against the state price for the same item.
% Difference from the State Average — District × Store Type
| Gombak | +0.1% | −0.2% | +2.7% | −4% | |
|---|---|---|---|---|---|
| Hulu Langat | −0.8% | −6.4% | +12% | −9.9% | +15% |
| Hulu Selangor | −3.1% | +3.9% | +5% | −11% | |
| Klang | +5.2% | −13% | −4.7% | −3.8% | |
| Kuala Langat | −7.5% | −3.6% | |||
| Kuala Selangor | +2.9% | −5.3% | +7% | −11% | |
| Petaling | +8.4% | −1.1% | +7.2% | −0.8% | +11% |
| Petaling Jaya | −0.2% | +1.1% | +1.9% | −5.8% | |
| Sabak Bernam | +6.4% | +0.1% | +3.8% | ||
| Sepang | +5.2% | +1% | +1.7% |
Each cell: the average percentage difference of prices at that store type in that district against the state average. The 8 store types with the most locations are shown.
vs National is computed as the average percentage difference of each item, so it is not skewed by differing item mixes across districts or store types. vs State Average uses a premise-count-weighted state price reference for each item.