Johor
Price coverage of 248 items at 205 locations across 10 districts.
Item List
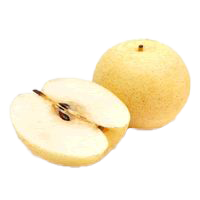
yellow lai (size M)
RM 2.70 /1 biji BUAH-BUAHAN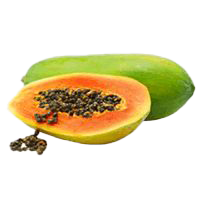
papaya (regular)
RM 7.80 /1kg BUAH-BUAHAN
pineapple (Josapine/Morris/Sarawak)
RM 3.69 /1 biji BUAH-BUAHAN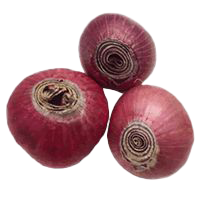
imported large onion (Pakistan)
RM 3.04 /1kg BAWANG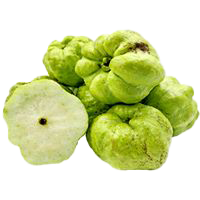
guava (seedless)
RM 11.89 /1kg BUAH-BUAHAN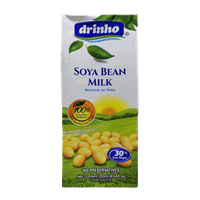
Drinho soy milk (box)
RM 1.30 /250 ml TERSEDIA MINUM▲ RM 0.13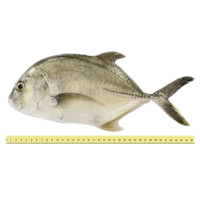
ponyfish (demuduk/cupak/cermin, <=3 per kg)
RM 23.41 /1kg BAHAN LAUT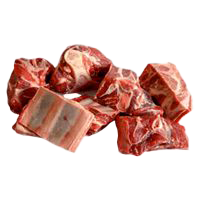
local bone-in mutton
RM 50.00 /1kg DAGING▼ RM 0.05
red chilli (akar variety)
RM 15.15 /1kg SAYUR-SAYURAN▼ RM 0.01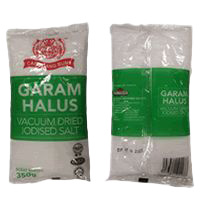
fine table salt (regular, various brands)
RM 1.23 /+-350g REMPAH RATUS (BERBUNGKUS)▼ RM 0.17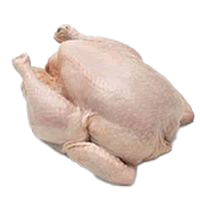
cleaned chicken (super grade)
RM 10.23 /1kg AYAM▼ RM 0.05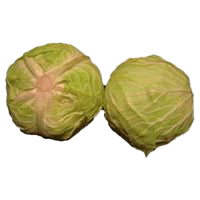
imported round cabbage (China)
RM 2.54 /1kg SAYUR-SAYURANBy District
Sorted from cheapest to priciest against the state average
Biggest Savings in Johor
 ECONSAVE KLUANG Kluang·Johor 151 barang −13.6% vs state average PASARAYA ECONSAVE BAKRI MUAR Muar·Johor 158 barang −13.5% vs state average PASARAYA ECONSAVE MUAR Muar·Johor 167 barang −13.1% vs state average PASARAYA ECONSAVE SEGAMAT Segamat·Johor 155 barang −13.0% vs state average ECONSAVE SENAI Johor Bahru·Johor 161 barang −12.9% vs state average ECONSAVE CASH & CARRY PONTIAN Pontian·Johor 156 barang −12.9% vs state average ECONSAVE SIMPANG RENGGAM Kluang·Johor 160 barang −12.4% vs state average ECONSAVE TAMAN DESA CEMERLANG Johor Bahru·Johor 156 barang −12.3% vs state average ECONSAVE TAMAN DAYA Johor Bahru·Johor 161 barang −12.3% vs state average ECONSAVE KOTA TINGGI Kota Tinggi·Johor 161 barang −11.5% vs state average
Stores selling items below the state average, sorted by the widest gap.
Johor tracks 248 items at 205 locations across 10 districts for the week of 2 November 2026. On average, prices are 0.9% lower than the national average.
Cheapest in Segamat (−4.4% vs the state average); most expensive in Ledang (+10.5%).
Main groups: Fresh Produce (92), Packaged Goods (87), Beverages (20).
By Category Group
% Difference from the State Average — District × Category Group
| Batu Pahat | +1.2% | +0.5% | +2.3% | +2% | +6.1% | +0.6% |
|---|---|---|---|---|---|---|
| Johor Bahru | +0.1% | +2.2% | +1.6% | +1.3% | +0.8% | +0.2% |
| Kluang | −0.6% | −0.4% | −3.9% | +0.6% | −1.4% | +2.6% |
| Kota Tinggi | +0.2% | +0.8% | +1.2% | +1.3% | +6.9% | +2.2% |
| Ledang | +15% | +8.2% | +18% | |||
| Mersing | 0% | −1.2% | −2.4% | +5.6% | +0.5% | −2.1% |
| Muar | −1.5% | −6.5% | −1.5% | −2.4% | −6.8% | −1% |
| Pontian | +0.9% | +2.9% | −2% | −3.6% | +2.3% | −0.2% |
| Segamat | −1.2% | −8.4% | −3.9% | −3.6% | −7.3% | −1.8% |
| Tangkak | −2.2% | −6.5% | −0.1% | −5% | −4.5% | −0.6% |
Each cell: the average percentage difference of every item in that group in that district against the state price for the same item.
% Difference from the State Average — District × Urbanisation
| Batu Pahat | +1.4% | ||
|---|---|---|---|
| Johor Bahru | +1.1% | ||
| Kluang | −0.6% | ||
| Kota Tinggi | +1.1% | ||
| Ledang | +11% | ||
| Mersing | −0.2% | ||
| Muar | −3.6% | ||
| Pontian | +1.1% | ||
| Segamat | −4.4% | ||
| Tangkak | −3.7% |
Each cell: the average percentage difference of prices in the Urban / Suburban / Rural parts of that district against the state price for the same item.
% Difference from the State Average — District × Store Type
| Batu Pahat | −1.6% | +3.7% | +4.3% | +6.7% | +2.8% |
|---|---|---|---|---|---|
| Johor Bahru | −1.3% | +7.9% | +11% | +8.2% | −4% |
| Kluang | −6.8% | +5.4% | +9.9% | +2.6% | +4% |
| Kota Tinggi | −3.6% | +6.1% | +9.1% | +7.8% | |
| Ledang | +11% | ||||
| Mersing | −1.3% | −0.5% | +4.7% | +5% | |
| Muar | −4.4% | −1.2% | +1.8% | +2.1% | −11% |
| Pontian | −3.8% | +15% | +12% | +8.1% | |
| Segamat | −5.8% | −1.7% | −1.1% | +1% | |
| Tangkak | −5% | +0.4% | +4.5% |
Each cell: the average percentage difference of prices at that store type in that district against the state average. The 8 store types with the most locations are shown.
vs National is computed as the average percentage difference of each item, so it is not skewed by differing item mixes across districts or store types. vs State Average uses a premise-count-weighted state price reference for each item.