Batu Pahat
Price coverage of 53 items at 10 locations in the Batu Pahat district.
Item List
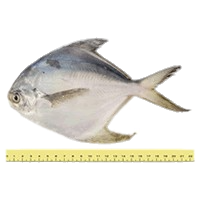
white pomfret (2-5 per kg)
RM 30.99 /1kg BAHAN LAUT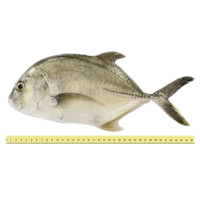
ponyfish (demuduk/cupak/cermin, <=3 per kg)
RM 18.00 /1kg BAHAN LAUT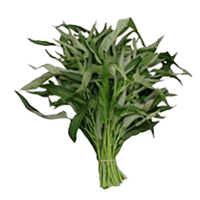
water spinach
RM 7.99 /1kg SAYUR-SAYURAN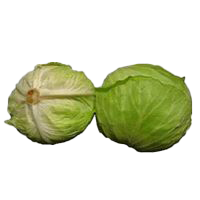
local round cabbage
RM 6.47 /1kg SAYUR-SAYURAN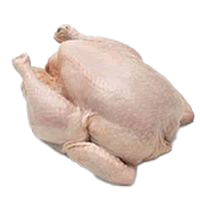
cleaned chicken (super grade)
RM 8.39 /1kg AYAM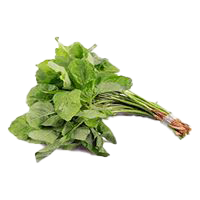
green spinach
RM 8.45 /1kg SAYUR-SAYURAN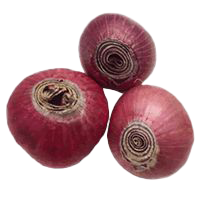
imported large onion (Pakistan)
RM 2.99 /1kg BAWANG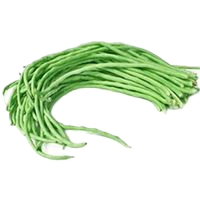
long beans
RM 10.87 /1kg SAYUR-SAYURAN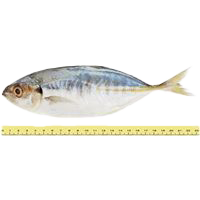
yellowtail scad (pelata, <=7 per kg)
RM 13.93 /1kg BAHAN LAUT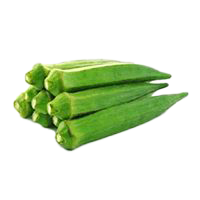
okra
RM 10.70 /1kg SAYUR-SAYURAN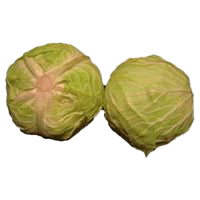
imported round cabbage (China)
RM 2.34 /1kg SAYUR-SAYURAN
red chilli (Kulai)
RM 18.17 /1kg SAYUR-SAYURANBiggest Savings in Batu Pahat
 HYPERMARKET LOTUS SDN BHD Batu Pahat·Johor 40 barang −18.4% vs district average
 TARGET SUPERMARKET (BATU PAHAT) SDN BHD Batu Pahat·Johor 41 barang −15.8% vs district average PASARAYA DIAN PANG CASH & CARRY Batu Pahat·Johor 39 barang −11.1% vs district average
 PASARAYA WELLWARD SDN BHD Batu Pahat·Johor 25 barang −7.6% vs district average
 PASARAYA ANGKASA Batu Pahat·Johor 41 barang −5.0% vs district average
 PASARAYA THE STORE (CAWANGAN JALAN RUGAYAH Batu Pahat·Johor 22 barang −3.3% vs district average PASAR AWAM BATU PAHAT Batu Pahat·Johor 45 barang −9.7% vs district average PASAR AWAM PARIT SULONG Batu Pahat·Johor 41 barang −10.1% vs district average
 PASARAYA HYPERMARKET AEON BIG Batu Pahat·Johor 43 barang −11.8% vs district average
 HYPERMARKET PACIFIC Batu Pahat·Johor 32 barang −24.3% vs district average
Stores selling items below the Batu Pahat district average, sorted by the widest gap.
The Batu Pahat district in Johor has 10 locations tracking 53 items for the week of 9 November 2026. On average, prices in Batu Pahat are on par with the national average.
Compared with the Johor average, Batu Pahat is 4.0% more expensive.
Suburban area · main chains: AEON, ANGKASA, TARGET.
By Category Group
% Difference from the District Average — Chain × Category Group
| AEON | +13% | −1.2% |
|---|---|---|
| ANGKASA | −6.6% | +4.2% |
| INDIE | +3.3% | +8.9% |
| LOTUS | −19% | −16% |
| PACIFIC | +21% | +38% |
| TARGET | −15% | −23% |
| THE STORE | +8.9% | −8.5% |
| WELLWARD | −4.1% | −21% |
Each cell: the average percentage difference of every item in that group at that chain against the district average for the same item. Chains with the most locations are listed first.
% Difference from the District Average — Store Type × Category Group
| Hypermarket | +6.2% | +5.7% |
|---|---|---|
| Supermarket | −7.8% | −11% |
| Wet Market | +8.7% | +16% |
Each cell: the average percentage difference of every item in that group at that store type against the district average for the same item. The 8 store types with the most locations are shown.
vs National is computed as the average percentage difference of each item, so it is not skewed by differing item mixes across chains or store types. vs State Average compares each item against the state average price for the same item. The cheapest-store list uses the district average price reference for each item.