Pulau Pinang
Price coverage of 52 items at 74 locations across 5 districts.
Item List
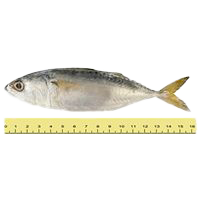
small Indian mackerel / yellowstripe scad (10-18 per kg)
RM 11.27 /1kg BAHAN LAUT▼ RM 0.23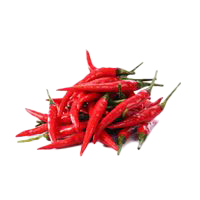
red chilli (akar variety)
RM 13.40 /1kg SAYUR-SAYURAN▲ RM 0.09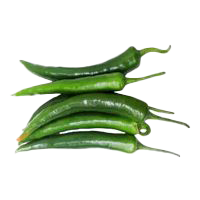
green chilli
RM 12.73 /1kg SAYUR-SAYURAN▲ RM 0.14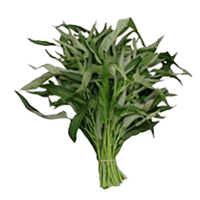
water spinach
RM 5.50 /1kg SAYUR-SAYURAN▼ RM 0.03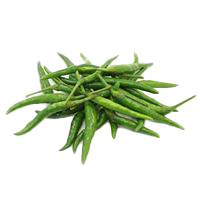
green chilli (akar variety)
RM 11.22 /1kg SAYUR-SAYURAN▲ RM 0.21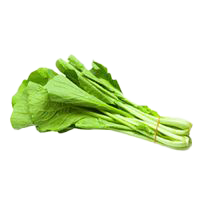
green mustard greens
RM 6.87 /1kg SAYUR-SAYURAN▼ RM 0.04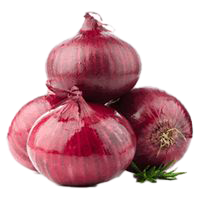
imported large onion (China)
RM 3.09 /1kg BAWANG▲ RM 0.03
red chilli (minyak variety)
RM 12.30 /1kg SAYUR-SAYURAN▼ RM 0.16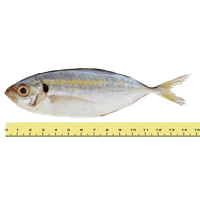
yellowtail scad (yellow, >=11 per kg)
RM 11.09 /1kg BAHAN LAUT▲ RM 0.03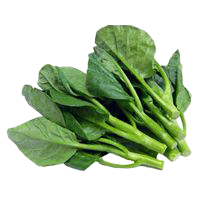
kai-lan (Chinese broccoli)
RM 10.71 /1kg SAYUR-SAYURAN▼ RM 0.21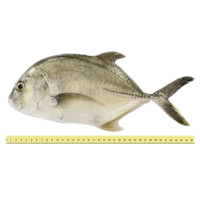
ponyfish (demuduk/cupak/cermin, <=3 per kg)
RM 30.71 /1kg BAHAN LAUT▼ RM 0.26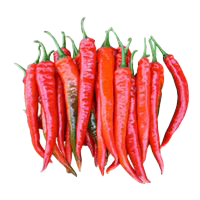
red chilli (Kulai)
RM 16.43 /1kg SAYUR-SAYURANBy District
Sorted from cheapest to priciest against the state average
Biggest Savings in Pulau Pinang
 LOTUS'S JELUTONG PULAU PINANG Timur Laut·Pulau Pinang 39 barang −21.3% vs state average LOTUS'S EXTRA SEBERANG JAYA Seberang Perai Tengah·Pulau Pinang 38 barang −20.2% vs state average LOTUS'S EXTRA SUNGAI DUA Barat Daya·Pulau Pinang 38 barang −19.3% vs state average LOTUS'S BAGAN AJAM Seberang Perai Utara·Pulau Pinang 33 barang −18.9% vs state average LOTUS'S TANJUNG PINANG Timur Laut·Pulau Pinang 36 barang −18.8% vs state average LOTUS'S BERTAM PERDANA Seberang Perai Utara·Pulau Pinang 37 barang −18.6% vs state average
 ECONSAVE CASH & CARRY (ALMA) SDN BHD Seberang Perai Tengah·Pulau Pinang 43 barang −18.4% vs state average ECONSAVE PAYA TERUBONG Timur Laut·Pulau Pinang 40 barang −18.2% vs state average LOTUS'S BUKIT MERTAJAM Seberang Perai Tengah·Pulau Pinang 37 barang −17.6% vs state average ECONSAVE CASH & CARRY BUTTERWORTH Seberang Perai Utara·Pulau Pinang 42 barang −17.2% vs state average
Stores selling items below the state average, sorted by the widest gap.
Pulau Pinang tracks 52 items at 74 locations across 5 districts for the week of 9 November 2026. On average, prices are 1.6% lower than the national average.
Cheapest in Seberang Perai Utara (−5.1% vs the state average); most expensive in Timur Laut (+4.3%).
Main groups: Fresh Produce (43), Dry Goods (9).
By Category Group
% Difference from the State Average — District × Category Group
| Barat Daya | −0.3% | +0.7% |
|---|---|---|
| Seberang Perai Selatan | +1.4% | −0.5% |
| Seberang Perai Tengah | −2.8% | −4.1% |
| Seberang Perai Utara | −4.5% | −8.5% |
| Timur Laut | +3.6% | +7.4% |
Each cell: the average percentage difference of every item in that group in that district against the state price for the same item.
% Difference from the State Average — District × Urbanisation
| Barat Daya | −0.1% | ||
|---|---|---|---|
| Seberang Perai Selatan | +1.1% | ||
| Seberang Perai Tengah | −3% | ||
| Seberang Perai Utara | −5.1% | ||
| Timur Laut | +4.3% |
Each cell: the average percentage difference of prices in the Urban / Suburban / Rural parts of that district against the state price for the same item.
% Difference from the State Average — District × Store Type
| Barat Daya | +8.1% | −5.1% | −14% |
|---|---|---|---|
| Seberang Perai Selatan | +6% | −8.7% | |
| Seberang Perai Tengah | +8.5% | −11% | −10% |
| Seberang Perai Utara | +2% | −15% | −16% |
| Timur Laut | +10% | +2.8% | −19% |
Each cell: the average percentage difference of prices at that store type in that district against the state average. The 8 store types with the most locations are shown.
vs National is computed as the average percentage difference of each item, so it is not skewed by differing item mixes across districts or store types. vs State Average uses a premise-count-weighted state price reference for each item.