Seberang Perai Utara
Price coverage of 232 items at 35 locations in the Seberang Perai Utara district.
Item List
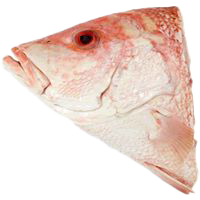
red snapper fish head
RM 17.00 /1kg BAHAN LAUT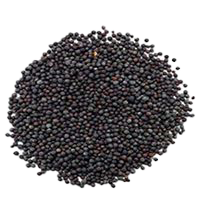
mustard seeds
RM 0.92 /100 g REMPAH RATUS (TIDAK BERBUNGKUS)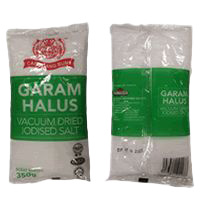
fine table salt (regular, various brands)
RM 0.68 /+-350g REMPAH RATUS (BERBUNGKUS)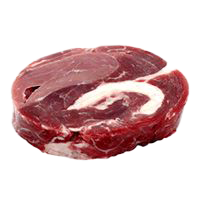
imported beef (block)
RM 49.20 /1kg DAGING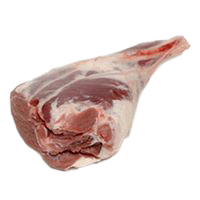
imported bone-in mutton leg (Australia)
RM 50.29 /1kg DAGING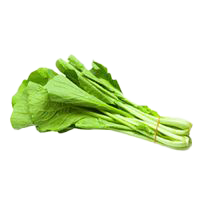
green mustard greens
RM 5.34 /1kg SAYUR-SAYURAN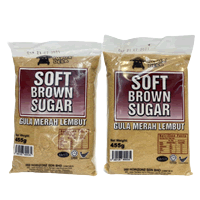
soft brown sugar (various brands)
RM 2.64 /+- 500g GULA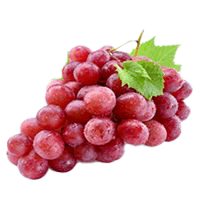
red grapes (seeded)
RM 8.74 /1kg BUAH-BUAHAN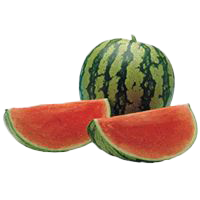
red watermelon (seedless)
RM 3.32 /1kg BUAH-BUAHAN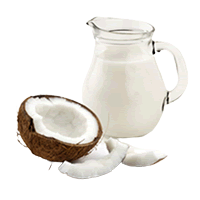
fresh coconut cream (regular)
RM 12.60 /1kg KELAPA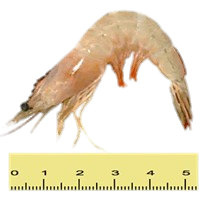
small white prawn (>=61 per kg)
RM 15.49 /1kg BAHAN LAUT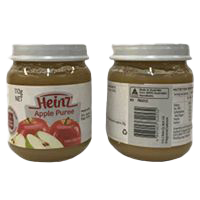
Heinz apple puree
RM 6.34 /110 g MAKANAN BAYIBiggest Savings in Seberang Perai Utara
 ECONSAVE CASH & CARRY RAJA UDA Seberang Perai Utara·Pulau Pinang 161 barang −7.8% vs district average ECONSAVE CASH & CARRY BUTTERWORTH Seberang Perai Utara·Pulau Pinang 171 barang −7.7% vs district average
 LOTUS'S BERTAM PERDANA Seberang Perai Utara·Pulau Pinang 143 barang −7.2% vs district average LOTUS'S BAGAN AJAM Seberang Perai Utara·Pulau Pinang 148 barang −6.9% vs district average YS FRESH & FROZEN SDN BHD Seberang Perai Utara·Pulau Pinang 76 barang −6.5% vs district average PASAR AWAM JETI LAMA Seberang Perai Utara·Pulau Pinang 52 barang −6.4% vs district average
 DAILY WHOLESALE & RETAIL SDN BHD Seberang Perai Utara·Pulau Pinang 96 barang −5.5% vs district average PASAR RAYA AA TEGUH Seberang Perai Utara·Pulau Pinang 58 barang −4.3% vs district average
 MYDIN WHOLESALE HYPERMARKET BERTAM Seberang Perai Utara·Pulau Pinang 169 barang −3.7% vs district average
Stores selling items below the Seberang Perai Utara district average, sorted by the widest gap.
The Seberang Perai Utara district in Pulau Pinang has 35 locations tracking 232 items for the week of 16 November 2026. On average, prices in Seberang Perai Utara are 4.5% lower than the national average.
Compared with the Pulau Pinang average, Seberang Perai Utara is 2.5% cheaper.
Urban area · main chains: SK FRESH, JMS, ECONSAVE.
By Category Group
% Difference from the District Average — Chain × Category Group
| BILLION | +2.1% | −13% | −8.1% | +0.8% | +1.6% | +1.7% |
|---|---|---|---|---|---|---|
| DAILY MART | −1.7% | −8.8% | −18% | −0.4% | ||
| ECONO JAYA | −1.4% | −1.3% | −22% | +1.1% | ||
| ECONSAVE | −5.5% | −11% | −15% | −3.5% | −4.4% | −2.2% |
| INDIE | +1.6% | +4.5% | +4.9% | +1.4% | ||
| JMS | +1.9% | +11% | +14% | −0.4% | ||
| LOTUS | −4.3% | −15% | −5.9% | −4.9% | +7.7% | −0.9% |
| LS MART | −1.5% | −0.3% | +6.4% | −6.3% | ||
| MF SEJAHTERA | +8.5% | +26% | +28% | +4.7% | ||
| MYDIN | −0.6% | −7% | −14% | −2% | −3.6% | +3.6% |
| SK FRESH | +0.7% | −8.2% | +4.5% | +2.5% |
Each cell: the average percentage difference of every item in that group at that chain against the district average for the same item. Chains with the most locations are listed first.
% Difference from the District Average — Store Type × Category Group
| Grocery Store | +2.3% | +0.1% | −5.8% | +2.7% | ||
|---|---|---|---|---|---|---|
| Hypermarket | −3% | −11% | −8.9% | −3.7% | +1.3% | +1.3% |
| Minimart | +1.3% | +2.2% | +3.9% | +0.9% | ||
| Supermarket | −2.6% | −10% | −11% | −0.1% | −1.5% | −1.2% |
| Wet Market | +2.5% | +5.7% | +6.2% |
Each cell: the average percentage difference of every item in that group at that store type against the district average for the same item. The 8 store types with the most locations are shown.
vs National is computed as the average percentage difference of each item, so it is not skewed by differing item mixes across chains or store types. vs State Average compares each item against the state average price for the same item. The cheapest-store list uses the district average price reference for each item.