W.p. Putrajaya
Price coverage of 236 items at 27 locations across 2 districts.
Item List
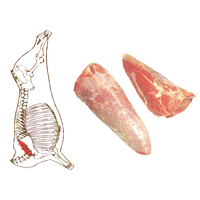
imported beef (chuck tender)
RM 81.40 /1kg DAGING▲ RM 1.61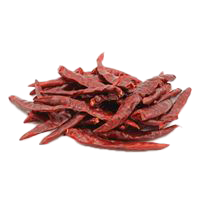
dried flat chilli (with/without stalk)
RM 33.71 /1kg CILI KERING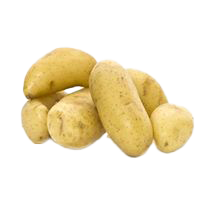
Holland potato
RM 2.50 /1kg UBI KENTANG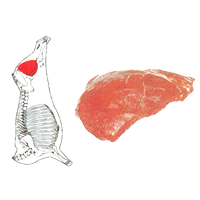
imported beef (topside)
RM 69.99 /1kg DAGING▼ RM 0.37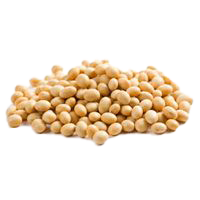
imported soybeans
RM 10.14 /1kg KACANG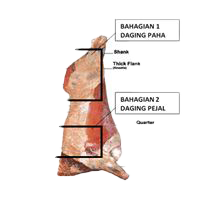
local beef (part 1: leg meat, excl. tenderloin)
RM 45.96 /1kg DAGING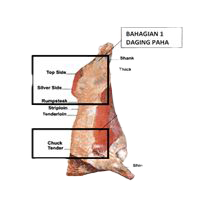
local beef (part 2: solid meat, excl. tenderloin)
RM 44.63 /1kg DAGING▼ RM 0.24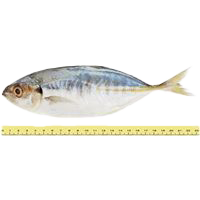
yellowtail scad (pelata, <=7 per kg)
RM 21.15 /1kg BAHAN LAUT▲ RM 0.08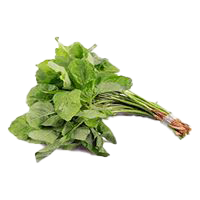
green spinach
RM 8.44 /1kg SAYUR-SAYURAN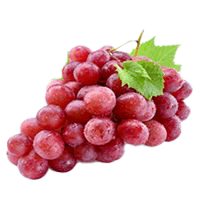
red grapes (seeded)
RM 13.75 /1kg BUAH-BUAHAN▼ RM 0.16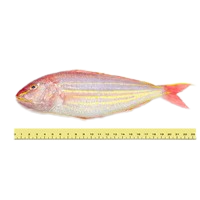
threadfin bream (5-10 per kg)
RM 19.16 /1kg BAHAN LAUT▼ RM 0.20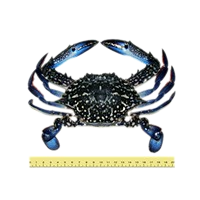
flower crab (5-8 per kg)
RM 45.73 /1kg BAHAN LAUTBy District
Sorted from cheapest to priciest against the state average
Biggest Savings in W.p. Putrajaya
 LOTUS’S IOI MALL PUTRAJAYA Wp Putrajaya·W.P. Putrajaya 172 barang −12.8% vs state average
 MYDIN BAZAAR PRESINT 15 Wp Putrajaya·W.P. Putrajaya 175 barang −10.9% vs state average
 PASAR MINI 99 SPEEDMART PRESINT 9 Wp Putrajaya·W.P. Putrajaya 36 barang −9.2% vs state average
 MY HERO HYPERMARKET PRESINT 3 Wp Putrajaya·W.P. Putrajaya 167 barang −8.1% vs state average
 SEGI FRESH PUTRAJAYA PRESINT 15 Wp Putrajaya·W.P. Putrajaya 129 barang −5.8% vs state average
 PASAR MINI DARUSSALAM PRESINT 9 Wp Putrajaya·W.P. Putrajaya 96 barang −5.3% vs state average PASARAYA DARUSSALAM XL PRESINT 4 Wp Putrajaya·W.P. Putrajaya 151 barang −5.0% vs state average
 PASARAYA STAR GROCER CYBERSQUARE Cyberjaya·W.P. Putrajaya 165 barang −2.8% vs state average PASAR MINI DARUSSALAM PRESINT 16 Wp Putrajaya·W.P. Putrajaya 98 barang −2.8% vs state average MBG FRESH MARKET Wp Putrajaya·W.P. Putrajaya 125 barang −2.4% vs state average
Stores selling items below the state average, sorted by the widest gap.
W.p. Putrajaya tracks 236 items at 27 locations across 2 districts for the week of 2 November 2026. On average, prices are 5.1% higher than the national average.
Cheapest in Wp Putrajaya (−1.7% vs the state average); most expensive in Cyberjaya (+4.0%).
Main groups: Fresh Produce (91), Packaged Goods (81), Hygiene Products (18).
By Category Group
% Difference from the State Average — District × Category Group
| Cyberjaya | +4.7% | +2.9% | −0.5% | +5.2% | +7% | +7.2% |
|---|---|---|---|---|---|---|
| Wp Putrajaya | −1.6% | −1.2% | +0.1% | −2.8% | −4.9% | −2% |
Each cell: the average percentage difference of every item in that group in that district against the state price for the same item.
% Difference from the State Average — District × Urbanisation
| Cyberjaya | +4% | ||
|---|---|---|---|
| Wp Putrajaya | −1.7% |
Each cell: the average percentage difference of prices in the Urban / Suburban / Rural parts of that district against the state price for the same item.
% Difference from the State Average — District × Store Type
| Cyberjaya | +1.9% | +3.7% | +7.2% | ||
|---|---|---|---|---|---|
| Wp Putrajaya | −1.7% | −5.6% | +6.6% | −1.8% | +7.9% |
Each cell: the average percentage difference of prices at that store type in that district against the state average. The 8 store types with the most locations are shown.
vs National is computed as the average percentage difference of each item, so it is not skewed by differing item mixes across districts or store types. vs State Average uses a premise-count-weighted state price reference for each item.