Kelantan
Price coverage of 234 items at 198 locations across 11 districts.
Item List
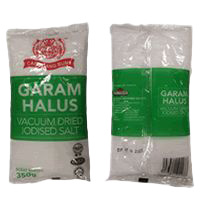
fine table salt (regular, various brands)
RM 2.13 /+-350g REMPAH RATUS (BERBUNGKUS)▼ RM 0.01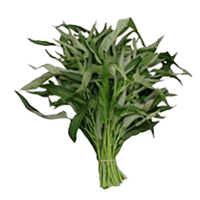
water spinach
RM 8.29 /1kg SAYUR-SAYURAN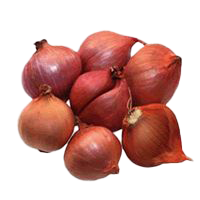
imported red shallot (Thailand)
RM 16.90 /1kg BAWANG
green bird's eye chilli
RM 18.99 /1kg SAYUR-SAYURAN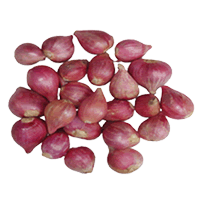
imported red shallot (China)
RM 4.00 /1kg BAWANG▲ RM 0.08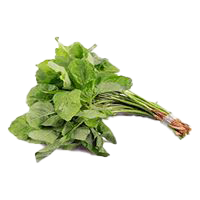
green spinach
RM 8.67 /1kg SAYUR-SAYURAN▼ RM 0.37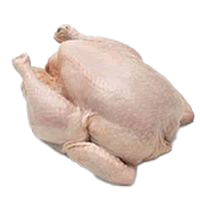
cleaned chicken (super grade)
RM 8.57 /1kg AYAM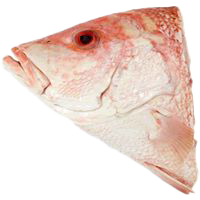
red snapper fish head
RM 35.52 /1kg BAHAN LAUT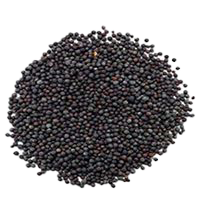
mustard seeds
RM 1.09 /100 g REMPAH RATUS (TIDAK BERBUNGKUS)
pineapple (Josapine/Morris/Sarawak)
RM 5.95 /1 biji BUAH-BUAHAN
red watermelon (seeded)
RM 3.55 /1kg BUAH-BUAHAN▼ RM 1.73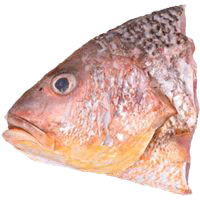
golden snapper fish head
RM 31.06 /1kg BAHAN LAUTBy District
Sorted from cheapest to priciest against the state average
Biggest Savings in Kelantan
 ECONSAVE CASH & CARRY (PP) Pasir Puteh·Kelantan 161 barang −12.5% vs state average ECONSAVE CASH & CARRY (KUBANG KERIAN) SDN.BHD Kota Bharu·Kelantan 146 barang −12.0% vs state average
 LOTUS'S KOTA BHARU Kota Bharu·Kelantan 157 barang −10.3% vs state average ECONSAVE CASH & CARRY (GM) SDN. BHD Gua Musang·Kelantan 144 barang −9.2% vs state average
 MYDIN PASIR MAS Pasir Mas·Kelantan 112 barang −7.8% vs state average PASAR BORONG GUCHIL Kuala Krai·Kelantan 61 barang −7.7% vs state average MYDIN WHOLESALE HYPERMARKET Kota Bharu·Kelantan 178 barang −7.1% vs state average MYDIN MALL TUNJONG Kota Bharu·Kelantan 168 barang −6.3% vs state average MYDIN MART PASIR PUTEH Pasir Puteh·Kelantan 145 barang −6.1% vs state average
 U ALL MART (PASIR MAS) SDN BHD Pasir Mas·Kelantan 139 barang −5.8% vs state average
Stores selling items below the state average, sorted by the widest gap.
Kelantan tracks 234 items at 198 locations across 11 districts for the week of 2 November 2026. On average, prices are 1.5% lower than the national average.
Cheapest in Pasir Puteh (−2.6% vs the state average); most expensive in Jeli (+9.4%).
Main groups: Fresh Produce (85), Packaged Goods (83), Dry Goods (18).
By Category Group
% Difference from the State Average — District × Category Group
| Bachok | +0.8% | +0.9% | +0.7% | +1.7% | +1.9% | −0.2% |
|---|---|---|---|---|---|---|
| Dabong | +2.2% | +11% | −0.2% | +7.4% | ||
| Gua Musang | −2% | +3.8% | −2.5% | −2% | −0.9% | 0% |
| Jeli | +1.7% | +21% | +16% | +3.2% | ||
| Kota Bharu | −0.2% | +1.2% | +1.4% | +0.2% | −3.7% | +0.1% |
| Kuala Krai | −0.9% | −3.6% | +1% | −1.7% | +1.7% | −0.5% |
| Machang | +0.2% | −3.7% | +3.2% | +2.1% | −0.5% | +0.1% |
| Pasir Mas | +0.4% | −0.9% | −2.6% | +2.1% | +1.4% | −1.1% |
| Pasir Puteh | −1.7% | −2.6% | −5.4% | −4.5% | −3.6% | −0.8% |
| Tanah Merah | +0.9% | −0.2% | +1% | −0.6% | +4% | −0.5% |
| Tumpat | +1.3% | +2.3% | +2.7% | +3.1% | +1.3% | −0.1% |
Each cell: the average percentage difference of every item in that group in that district against the state price for the same item.
% Difference from the State Average — District × Urbanisation
| Bachok | +0.9% | ||
|---|---|---|---|
| Dabong | +5.2% | ||
| Gua Musang | +0.3% | ||
| Jeli | +9.4% | ||
| Kota Bharu | +0.1% | ||
| Kuala Krai | −1.6% | ||
| Machang | −0.8% | ||
| Pasir Mas | −0.2% | ||
| Pasir Puteh | −2.6% | ||
| Tanah Merah | +0.6% | ||
| Tumpat | +1.8% |
Each cell: the average percentage difference of prices in the Urban / Suburban / Rural parts of that district against the state price for the same item.
% Difference from the State Average — District × Store Type
| Bachok | +5.2% | −0.6% | +2.8% | ||
|---|---|---|---|---|---|
| Dabong | +5.2% | ||||
| Gua Musang | +2.1% | +6.8% | −1.5% | +16% | −9.2% |
| Jeli | +9.4% | +12% | |||
| Kota Bharu | +4.3% | +5.6% | −0.4% | +2.3% | −2.4% |
| Kuala Krai | +7.8% | +6.2% | −3.6% | +1.3% | |
| Machang | −0.3% | +1.3% | −2.9% | +2% | |
| Pasir Mas | −0.5% | +3.7% | −1.7% | +6.6% | |
| Pasir Puteh | +1% | −2% | +3.3% | −12% | |
| Tanah Merah | −1.4% | +3.3% | −1.2% | +6.3% | |
| Tumpat | +4.7% | +0.5% | 0% | +4.3% |
Each cell: the average percentage difference of prices at that store type in that district against the state average. The 8 store types with the most locations are shown.
vs National is computed as the average percentage difference of each item, so it is not skewed by differing item mixes across districts or store types. vs State Average uses a premise-count-weighted state price reference for each item.