Category Group × State
Dry Goods in Kelantan
Weekly trends for Dry Goods in Kelantan.
Categories 2 in this group
Items 9 types tracked
Stores 80 selling these items
Districts 9 with data
Weekly Trend -0.8% overall average
01 9 items
Item List
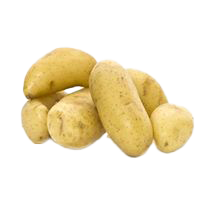
Holland potato
RM 3.25 /1kg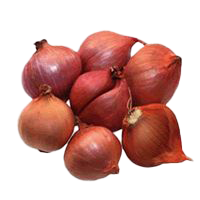
imported red shallot (Thailand)
RM 16.90 /1kg ▼ RM 0.05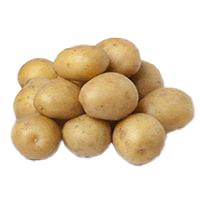
imported potato (China)
RM 2.52 /1kg ▼ RM 0.32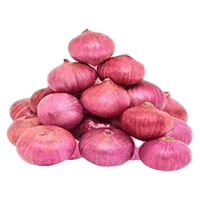
imported large onion (India)
RM 3.36 /1kg ▼ RM 0.01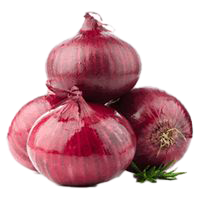
imported large onion (China)
RM 3.30 /1kg ▲ RM 0.09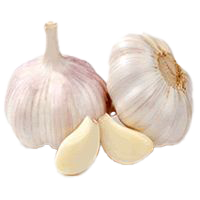
imported garlic (China)
RM 9.15 /1kg ▲ RM 0.07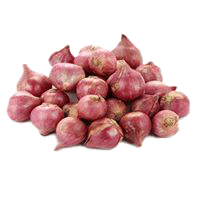
imported red shallot, regular (India)
RM 3.99 /1kg ▲ RM 0.06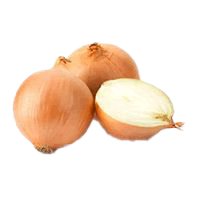
large onion (yellow / Holland)
RM 4.32 /1kg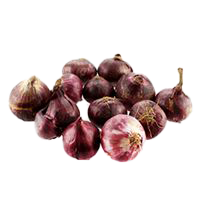
imported rose shallot (India)
RM 5.75 /1kgListed prices are the state average (Kelantan) for each item.
02 vs national average
Difference from the national average by category
Sorted by item count
03 22 cheapest stores
Biggest Savings — Dry Goods in Kelantan
 MYDIN WHOLESALE HYPERMARKET Hypermarket Kota Bharu·Kelantan 5 barang −24.7% vs state average MYDIN MART PASIR PUTEH Supermarket Pasir Puteh·Kelantan 5 barang −21.1% vs state average
 ECONSAVE CASH & CARRY (KUBANG KERIAN) SDN.BHD Hypermarket Kota Bharu·Kelantan 5 barang −19.6% vs state average MYDIN PASIR MAS Supermarket Pasir Mas·Kelantan 5 barang −16.6% vs state average MYDIN MALL TUNJONG Hypermarket Kota Bharu·Kelantan 6 barang −15.3% vs state average
 PASARAYA PANTAI TIMOR MACHANG Supermarket Machang·Kelantan 5 barang −14.5% vs state average
 LOTUS'S KOTA BHARU Hypermarket Kota Bharu·Kelantan 5 barang −14.0% vs state average PANTAI TIMOR MART LUBOK JONG Supermarket Pasir Mas·Kelantan 5 barang −13.4% vs state average
 PASARAYA ECONJAYA Supermarket Machang·Kelantan 5 barang −10.2% vs state average
 GIANT SUPERSTORE TUNJONG Supermarket Kota Bharu·Kelantan 5 barang −8.5% vs state average PASARAYA PKT (GUA MUSANG) SDN. BHD Supermarket Gua Musang·Kelantan 5 barang −7.3% vs state average
 BS FRESHMART Supermarket Gua Musang·Kelantan 7 barang −6.6% vs state average
Stores selling Dry Goods below the state average, sorted by the widest gap.
04 vs state average
% Difference from the State Average — District × Category
| Bachok | +4.2% | +7.1% |
|---|---|---|
| Gua Musang | +0.7% | −5.8% |
| Kota Bharu | −3.7% | −14% |
| Kuala Krai | +1.9% | +14% |
| Machang | −7.6% | +8.5% |
| Pasir Mas | −0.2% | +3.7% |
| Pasir Puteh | −7.9% | −17% |
| Tanah Merah | +3.8% | +17% |
| Tumpat | +6.9% | +31% |
Cheaper Pricier
Each cell: the average percentage difference of items in that category in that district against the state average.
05 vs state average
% Difference from the State Average — Store Type × Category
| Hypermarket | −6.9% | −25% |
|---|---|---|
| Minimart | −2.3% | −17% |
| Supermarket | −0.4% | +1.5% |
| Wet Market | +12% | +27% |
Cheaper Pricier
Each cell: the average percentage difference of items in that category at that store type against the state average.
Notes
vs National is computed as the average percentage difference of each item against the national price.