Dry Goods
Weekly trend and coverage of 12 items across 2 categories in 16 states.
Item List
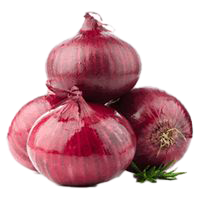
imported large onion (China)
RM 3.49 /1kg Onions▼ RM 0.03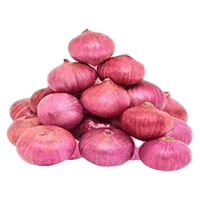
imported large onion (India)
RM 4.05 /1kg Onions▼ RM 0.14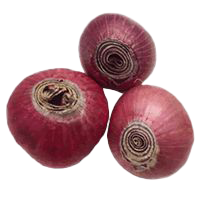
imported large onion (Pakistan)
RM 3.65 /1kg Onions▼ RM 0.10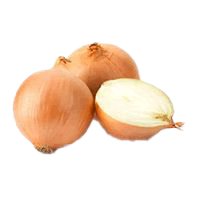
large onion (yellow / Holland)
RM 4.16 /1kg Onions▲ RM 0.01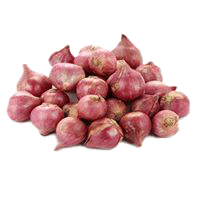
imported red shallot, regular (India)
RM 4.59 /1kg Onions▲ RM 0.06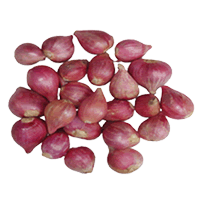
imported red shallot (China)
RM 5.64 /1kg Onions▼ RM 1.38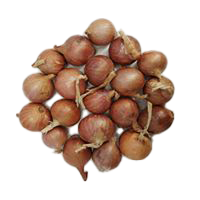
imported red shallot (Myanmar)
RM 4.20 /1kg Onions▲ RM 0.27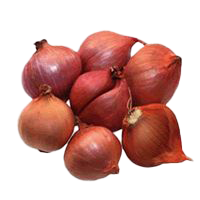
imported red shallot (Thailand)
RM 13.12 /1kg Onions▼ RM 0.10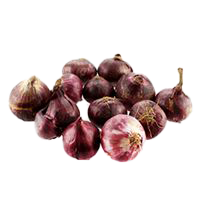
imported rose shallot (India)
RM 6.39 /1kg Onions▼ RM 0.14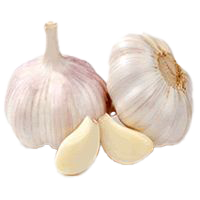
imported garlic (China)
RM 9.29 /1kg Onions▼ RM 0.05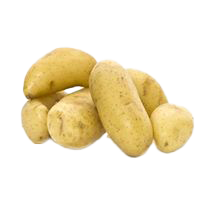
Holland potato
RM 4.11 /1kg Potatoes▼ RM 0.13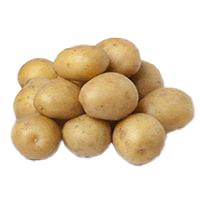
imported potato (China)
RM 2.98 /1kg PotatoesBy Category
Sorted from the largest weekly drop to the biggest rise
Best Value for Dry Goods
 TARGET SUPERMARKET (PONTIAN) SDN. BHD. Supermarket Pontian·Johor 8 barang −32.5% vs kebangsaan
 ECONSAVE CASH AND CARRY MALIM S/B Supermarket Melaka Tengah·Melaka 6 barang −30.3% vs kebangsaan ECONSAVE SERI ISKANDAR Supermarket Perak Tengah·Perak 6 barang −30.2% vs kebangsaan
 TF VALUE MART SDN BHD SEGAMAT Supermarket Segamat·Johor 6 barang −29.4% vs kebangsaan PASARAYA ECONSAVE KAPAR SDN BHD Supermarket Klang·Selangor 6 barang −28.5% vs kebangsaan PASARAYA ECONSAVE JASIN Supermarket Jasin·Melaka 6 barang −28.4% vs kebangsaan TARGET GRAND SUPERMARKET (PERDANA) KLUANG PARKLAND Supermarket Kluang·Johor 6 barang −26.8% vs kebangsaan
 BATARAS SUPERSTORE KENINGAU Supermarket Keningau·Sabah 6 barang −26.8% vs kebangsaan ECONSAVE CASH & CARRY RAJA UDA Supermarket Seberang Perai Utara·Pulau Pinang 6 barang −26.4% vs kebangsaan ECONSAVE CASH & CARRY (ALMA) SDN BHD Supermarket Seberang Perai Tengah·Pulau Pinang 6 barang −26.4% vs kebangsaan BATARAS SUPERSTORE Supermarket Kota Kinabalu·Sabah 6 barang −26.4% vs kebangsaan
 PASARAYA NIRWANA SEGAMAT Supermarket Segamat·Johor 6 barang −26.3% vs kebangsaan
Stores selling this group’s items below the national average, sorted by the largest gap.
The Dry Goods category covers 12 items across 2 categories, sold at 1,125 stores in 16 states for the week of 9 November 2026. On average, prices are 2.0% higher than the week before.
Cheapest in Kedah (−4.9% vs national); most expensive in Perlis (+15.4%).
Main categories: Onions (10), Potatoes (2).
Weekly Trend — State × Category
| Johor | +2.5% | +2.6% |
|---|---|---|
| Kedah | +0.5% | +3.7% |
| Kelantan | −0.3% | +1.6% |
| Melaka | +1.2% | +4% |
| Negeri Sembilan | +2.9% | +2.4% |
| Pahang | +2.4% | +3.2% |
| Perak | +1.9% | +3.7% |
| Perlis | +5.3% | +6.6% |
| Pulau Pinang | +2.4% | +3.6% |
| Sabah | +0.8% | +1.9% |
| Sarawak | +1.8% | +0.8% |
| Selangor | +2.7% | +3.4% |
| Terengganu | +0.2% | +1.1% |
| W.P. Kuala Lumpur | +2.2% | +2% |
| W.P. Labuan | +1.6% | +2.3% |
| W.P. Putrajaya | +3.6% | +4.3% |
Each cell: the change in that category’s average price in that state versus last week. Green = down, red = up.
% Difference from National Average — State × Category
| Johor | −3.1% | −8.7% |
|---|---|---|
| Kedah | −5% | −4.3% |
| Kelantan | −1.1% | −17% |
| Melaka | −0.4% | −2.1% |
| Negeri Sembilan | +3.4% | −2.1% |
| Pahang | −4% | +3.5% |
| Perak | +4.7% | −1.8% |
| Perlis | +11% | +30% |
| Pulau Pinang | +1.2% | +5% |
| Sabah | −1.5% | +15% |
| Sarawak | +6.9% | +4.7% |
| Selangor | −2% | +5.7% |
| Terengganu | −7.5% | +8% |
| W.P. Kuala Lumpur | +3.9% | −1.3% |
| W.P. Labuan | +4.2% | +8.5% |
| W.P. Putrajaya | +2% | −19% |
Each cell: the average percentage difference of every item in that category in that state versus the national price. Green = lower, red = higher.
% Difference from National Average — Category × Store Type
| Onions | −3.9% | +13% | +0.9% |
|---|---|---|---|
| Potatoes | −11% | +16% | +1.4% |
Each cell: the average percentage difference of every item in that category at that store type (Supermarket, Grocer, or Wet Market) versus the national price.
vs National is computed as the average per-item percentage difference, so it is not skewed by the differing mix of items across states or store types. The matrix above shows the first 8 categories by item count; other categories are available in the Categories grid above.