Gua Musang
Price coverage of 201 items at 19 locations in the Gua Musang district.
Item List
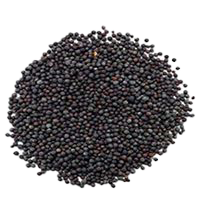
mustard seeds
RM 0.74 /100 g REMPAH RATUS (TIDAK BERBUNGKUS)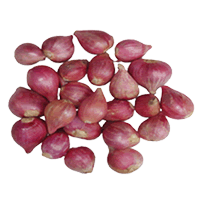
imported red shallot (China)
RM 4.00 /1kg BAWANG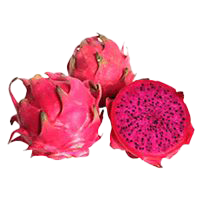
red dragon fruit
RM 14.09 /1kg BUAH-BUAHAN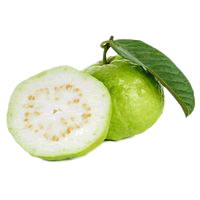
guava (seeded)
RM 10.84 /1kg BUAH-BUAHAN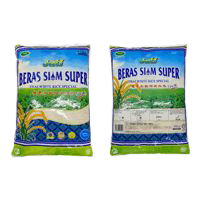
imported super rice, Jati TWR brand (5%)
RM 41.90 /10 kg BERAS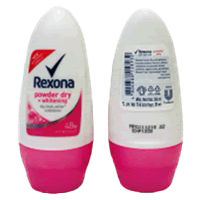
Rexona deodorant (Powder Dry Brightening)
RM 13.50 /50 ml PENJAGAAN DIRI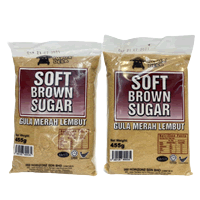
soft brown sugar (various brands)
RM 2.60 /+- 500g GULA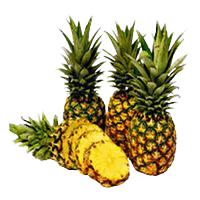
pineapple (Josapine/Morris/Sarawak)
RM 5.90 /1 biji BUAH-BUAHAN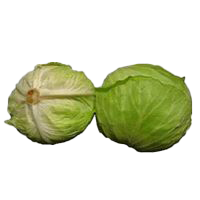
local round cabbage
RM 4.01 /1kg SAYUR-SAYURAN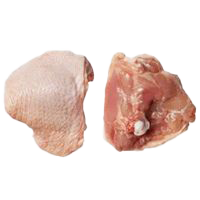
chicken thigh
RM 15.50 /1kg AYAM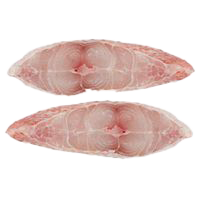
red snapper (slices)
RM 42.97 /1kg BAHAN LAUT
red grapes (seeded)
RM 8.99 /1kg BUAH-BUAHANBiggest Savings in Gua Musang
 ECONSAVE CASH & CARRY (GM) SDN. BHD Gua Musang·Kelantan 128 barang −8.7% vs district average
 BS FRESHMART Gua Musang·Kelantan 123 barang −3.1% vs district average
 ALIEF MAJU SDN. BHD. (CHIKU 3) Gua Musang·Kelantan 58 barang −1.8% vs district average PASARAYA PKT (GUA MUSANG) SDN. BHD Gua Musang·Kelantan 127 barang −1.4% vs district average
 PASARAYA ECONJAYA (GM) SDN. BHD. Gua Musang·Kelantan 126 barang −1.1% vs district average
 TUNAS MANJA GROUP (TMG) Gua Musang·Kelantan 100 barang −1.0% vs district average
 TF VALUE MART (GUA MUSANG) SDN. BHD Gua Musang·Kelantan 159 barang −0.8% vs district average GM KASMA ENTERPRISE Gua Musang·Kelantan 20 barang −0.5% vs district average PASAR MINI MAE Gua Musang·Kelantan 13 barang −0.2% vs district average SMS MAJU SOLUTION Gua Musang·Kelantan 64 barang −1.1% vs district average
Stores selling items below the Gua Musang district average, sorted by the widest gap.
The Gua Musang district in Kelantan has 19 locations tracking 201 items for the week of 16 November 2026. On average, prices in Gua Musang are 2.3% lower than the national average.
Prices in Gua Musang are on par with the Kelantan average.
Rural area · main chains: ALIEF MAJU, TF VALUE MART, ECONSAVE.
By Category Group
% Difference from the District Average — Chain × Category Group
| AGRO BAZAAR | +3.5% | +23% | +11% | +24% | ||
|---|---|---|---|---|---|---|
| ALIEF MAJU | −1.5% | −0.5% | −1.1% | +6.9% | ||
| BS FRESHMART | −0.8% | −4.5% | −3.6% | −11% | −0.3% | +1.4% |
| ECONJAYA | −0.3% | −3.5% | −0.4% | −8.1% | +4.5% | +1.5% |
| ECONSAVE | −6.1% | −11% | −5% | −16% | −9.4% | −5.8% |
| INDIE | +2.8% | +1.7% | +1.6% | −1.6% | +0.5% | +2.4% |
| RA | +7.2% | +36% | +5.3% | +62% | ||
| TF VALUE MART | +0.1% | −4% | +1.7% | +1.3% | +0.6% | +2.5% |
| TMG | −2.8% | +0.5% | −3.6% | +4.2% | +0.3% | −6.6% |
Each cell: the average percentage difference of every item in that group at that chain against the district average for the same item. Chains with the most locations are listed first.
% Difference from the District Average — Store Type × Category Group
| Grocery Store | +1.1% | +7.7% | +1.7% | +11% | ||
|---|---|---|---|---|---|---|
| Hypermarket | −6.1% | −11% | −5% | −16% | −9.4% | −5.8% |
| Minimart | +2.6% | +1% | ||||
| Supermarket | +0.4% | −2% | −1.2% | −3.7% | +1.2% | +1% |
| Wet Market | +7.8% | +15% | +26% |
Each cell: the average percentage difference of every item in that group at that store type against the district average for the same item. The 8 store types with the most locations are shown.
vs National is computed as the average percentage difference of each item, so it is not skewed by differing item mixes across chains or store types. vs State Average compares each item against the state average price for the same item. The cheapest-store list uses the district average price reference for each item.