Rice
Weekly trend and coverage of 17 items across 4 subcategories in 16 states.
Item List
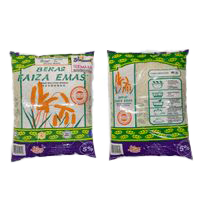
rice, Faiza Emas brand (5%)
RM 25.99 /10 kg Rice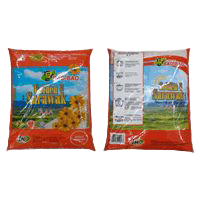
rice, Golden Sarawak brand (5%)
RM 28.07 /10 kg Rice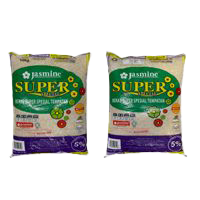
rice, Jasmine brand (5%)
RM 25.45 /10 kg Rice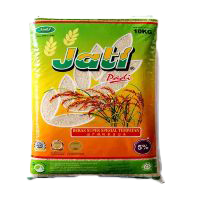
rice, Jati brand (5%)
RM 26.00 /10 kg Rice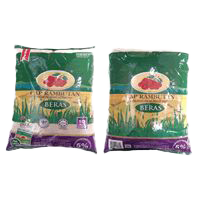
rice, Rambutan brand (5%)
RM 38.00 /10 kg Rice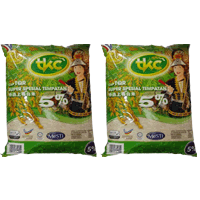
rice, Sabah TKC brand (TQR 5%)
RM 34.58 /10 kg Rice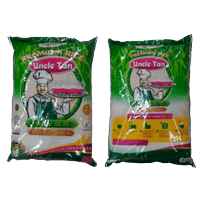
premium rice, Uncle Tan brand
RM 30.71 /10 kg Premium Rice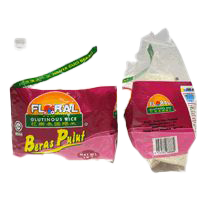
Thai glutinous rice, regular (various brands)
RM 7.65 /1kg Glutinous Rice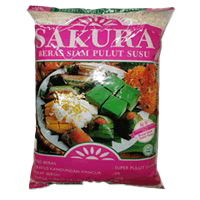
Thai glutinous rice, susu grade (various brands)
RM 9.20 /1kg Glutinous Rice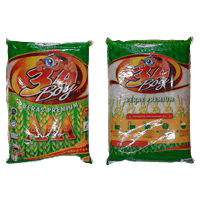
imported super rice, 3A Boy brand
RM 29.72 /10 kg Super Rice (Standard Grade)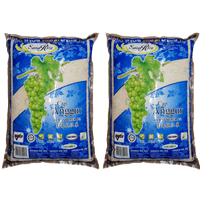
imported super rice, Anggur Sazarice brand (5%, Thailand)
RM 28.67 /10 kg Super Rice (Standard Grade)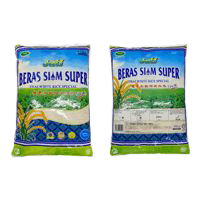
imported super rice, Jati TWR brand (5%)
RM 32.57 /10 kg Super Rice (Standard Grade)By Subcategory
Sorted from the largest weekly drop to the biggest rise
Latest Rice prices in Malaysia (Packaged Goods): 17 types tracked across 16 states for the week of 16 November 2026. Johor has the lowest prices (−8.0% vs national).
Cheapest in Johor (−8.0% vs national); most expensive in Kelantan (+2.9%).
Main subcategories: Super Rice (Standard Grade) (8), Rice (6), Glutinous Rice (2).
Weekly Trend — State × Subcategory
Each cell: the change in that subcategory’s average price in that state versus last week. Green = down, red = up.
% Difference from National Average — State × Subcategory
| Johor | −0.8% | −13% | ||
|---|---|---|---|---|
| Kedah | −0.7% | +0.9% | ||
| Kelantan | +6.2% | +0.7% | ||
| Melaka | +1.3% | 0% | ||
| Negeri Sembilan | −1.5% | +2.2% | ||
| Pahang | −0.7% | +1.1% | ||
| Perak | −1.7% | +0.7% | ||
| Perlis | +0.4% | +0.6% | ||
| Pulau Pinang | −2.4% | +1.1% | −4.7% | |
| Sabah | 0% | 0% | ||
| Sarawak | 0% | 0% | 0% | |
| Selangor | +0.3% | +0.7% | ||
| Terengganu | +2.9% | +2.2% | ||
| W.P. Kuala Lumpur | +5.2% | 0% | +2.1% | |
| W.P. Labuan | +0.8% | −0.2% | ||
| W.P. Putrajaya | +1.4% | +2.2% |
Each cell: the average percentage difference of every item in that subcategory in that state versus the national price. Green = lower, red = higher.
% Difference from National Average — Store Type × Subcategory
| Grocery Store | +1.7% | +1% | +0.7% | |
|---|---|---|---|---|
| Hypermarket | −1% | +0.3% | +0.5% | |
| Minimart | −0.2% | +0.5% | −0.8% | |
| Supermarket | +0.1% | −0.5% | 0% | +0.1% |
| Wet Market | +1.1% | +0.9% |
Each cell: the average percentage difference of every item in that subcategory at that store type versus the national price. Store types with the most locations are listed first.
vs National is computed as the average per-item percentage difference, so it is not skewed by the differing mix of items across states or store types. The matrix above shows the first 8 subcategories by item count; other subcategories are available in the Subcategories grid above.