Packaged Goods
Weekly trend and coverage of 101 items across 15 categories in 16 states.
Item List
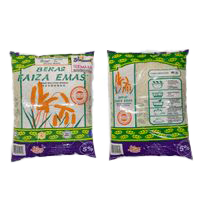
rice, Faiza Emas brand (5%)
RM 25.99 /10 kg Rice ▼ RM 0.01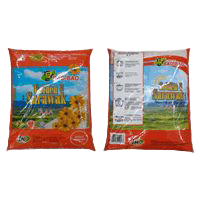
rice, Golden Sarawak brand (5%)
RM 28.07 /10 kg Rice ▼ RM 0.69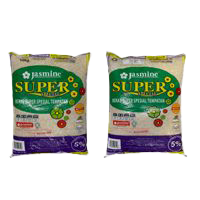
rice, Jasmine brand (5%)
RM 25.45 /10 kg Rice ▲ RM 0.02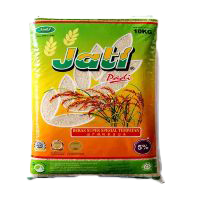
rice, Jati brand (5%)
RM 26.00 /10 kg Rice ▲ RM 12.00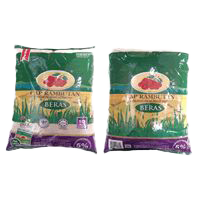
rice, Rambutan brand (5%)
RM 38.00 /10 kg Rice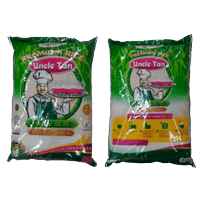
premium rice, Uncle Tan brand
RM 30.71 /10 kg Rice ▲ RM 0.08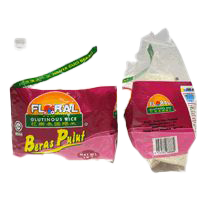
Thai glutinous rice, regular (various brands)
RM 7.65 /1kg Rice ▲ RM 1.06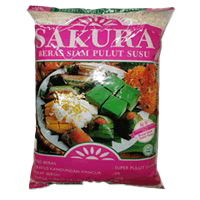
Thai glutinous rice, susu grade (various brands)
RM 9.20 /1kg Rice ▼ RM 0.01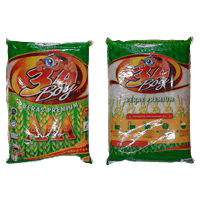
imported super rice, 3A Boy brand
RM 29.72 /10 kg Rice ▼ RM 0.02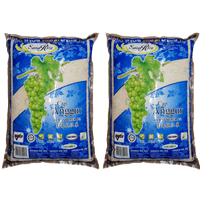
imported super rice, Anggur Sazarice brand (5%, Thailand)
RM 28.67 /10 kg Rice ▼ RM 0.51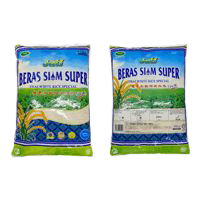
imported super rice, Jati TWR brand (5%)
RM 32.57 /10 kg Rice ▼ RM 0.16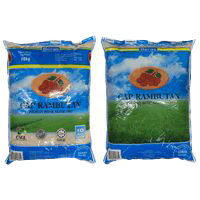
imported super rice, Rambutan brand (5%)
RM 36.24 /10 kg RiceBy Category
Sorted from the largest weekly drop to the biggest rise
Best Value for Packaged Goods
 PASARAYA ECONSAVE FOREST HEIGHT Supermarket Seremban·Negeri Sembilan 57 barang −10.1% vs kebangsaan ECONSAVE BOTANI VILLAGE Supermarket Kinta·Perak 53 barang −10.1% vs kebangsaan ECONSAVE CASH & CARRY SDN. BHD. KAMUNTING Supermarket Larut, Matang & Selama·Perak 65 barang −10.0% vs kebangsaan ECONSAVE JELAPANG Supermarket Kinta·Perak 54 barang −9.9% vs kebangsaan ECONSAVE PORT DICKSON Hypermarket Port Dickson·Negeri Sembilan 62 barang −9.8% vs kebangsaan ECONSAVE KUALA SELANGOR Supermarket Kuala Selangor·Selangor 63 barang −9.8% vs kebangsaan ECONSAVE CASH & CARRY SDN. BHD. (SLIM RIVER) Supermarket Muallim·Perak 54 barang −9.7% vs kebangsaan PASARAYA ECONSAVE KAPAR SDN BHD Supermarket Klang·Selangor 56 barang −9.7% vs kebangsaan ECONSAVE CASH AND CARRY MALIM S/B Supermarket Melaka Tengah·Melaka 61 barang −9.6% vs kebangsaan ECONSAVE AMPANG Supermarket Kinta·Perak 58 barang −9.6% vs kebangsaan ECONSAVE PERMAS JAYA Supermarket Johor Bahru·Johor 57 barang −9.5% vs kebangsaan ECONSAVE CASH & CARRY BUTTERWORTH Supermarket Seberang Perai Utara·Pulau Pinang 68 barang −9.5% vs kebangsaan
Stores selling this group’s items below the national average, sorted by the largest gap.
The Packaged Goods category covers 101 items across 15 categories, sold at 1,947 stores in 16 states for the week of 16 November 2026.
Cheapest in Melaka (−2.8% vs national); most expensive in W.P. Labuan (+6.9%).
Main categories: Cooking Oil and Fats (32), Rice (17), Spices (Packaged) (14).
Weekly Trend — State × Category
Each cell: the change in that category’s average price in that state versus last week. Green = down, red = up.
% Difference from National Average — State × Category
| Johor | −0.6% | −8% | −0.2% | −0.8% | −0.5% | +0.3% | −1.8% | −1.9% |
|---|---|---|---|---|---|---|---|---|
| Kedah | −1.3% | +0.1% | −2.9% | −2.2% | −1.9% | −0.4% | −3.6% | −3.6% |
| Kelantan | +0.6% | +2.9% | +7.5% | +1.2% | −1.5% | −1% | +2.6% | −1.4% |
| Melaka | −1.8% | +0.9% | −4.6% | −2.2% | −0.6% | −1.1% | −4.5% | −2.4% |
| Negeri Sembilan | −1.9% | −0.2% | −3.8% | −2.8% | −0.9% | −1.5% | −1.1% | −1.6% |
| Pahang | −0.2% | +0.2% | −2.2% | −1.4% | −1.7% | −0.9% | −2.1% | +0.1% |
| Perak | −1.6% | −0.3% | −4.6% | −3.8% | −2.9% | −1% | −4.3% | −2.1% |
| Perlis | +0.3% | +0.5% | +0.3% | −0.3% | −2.4% | +1.6% | −1.9% | −2.3% |
| Pulau Pinang | −2.5% | −2% | −3.4% | −2.5% | −1% | +0.1% | −2% | −1.7% |
| Sabah | +2.2% | 0% | +8.3% | +2.3% | +7.5% | +4% | +3.4% | +2.6% |
| Sarawak | +2.2% | 0% | +5.6% | +2.5% | +3.2% | +2.8% | +2.5% | +4.4% |
| Selangor | −1.4% | +0.5% | −5.1% | −1.3% | −1.4% | −0.9% | −0.7% | +0.5% |
| Terengganu | +0.3% | +2.7% | −0.5% | +1.3% | +1.6% | −0.4% | −0.8% | −0.5% |
| W.P. Kuala Lumpur | +0.3% | +2.9% | −0.1% | +2.6% | +1.4% | +4.1% | +4.1% | +4.5% |
| W.P. Labuan | +3.2% | +0.6% | +16% | +5.1% | +8.7% | +4.4% | −0.1% | +13% |
| W.P. Putrajaya | −1% | +1.7% | +0.2% | +2.2% | +4.2% | +4.2% | +3.3% | +4% |
Each cell: the average percentage difference of every item in that category in that state versus the national price. Green = lower, red = higher.
% Difference from National Average — Category × Store Type
| Coconut Milk (UHT / Boxed) | +2.2% | −2.4% | +6.2% |
|---|---|---|---|
| Cooking Oil and Fats | −1.1% | −0.2% | +0.3% |
| Creamer and Powdered Milk | +0.6% | −0.6% | +1.9% |
| Flour | +2.1% | −0.7% | +7.7% |
| Rice | +0.3% | −0.3% | +1% |
| Soy Sauce and Condiments | +1.5% | −1.9% | +4.5% |
| Spices (Packaged) | +1.6% | +0.4% | +1.6% |
| Spreads | +1% | −0.5% | +5.7% |
Each cell: the average percentage difference of every item in that category at that store type (Supermarket, Grocer, or Wet Market) versus the national price.
vs National is computed as the average per-item percentage difference, so it is not skewed by the differing mix of items across states or store types. The matrix above shows the first 8 categories by item count; other categories are available in the Categories grid above.