Eggs
Weekly trend and coverage of 3 items across 1 subcategories in 4 states.
Item List
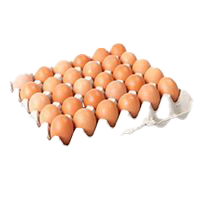
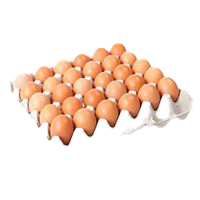
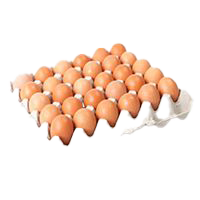
By Subcategory
Sorted from the largest weekly drop to the biggest rise
Best Value for Eggs
 TUNAS MANJA GROUP (TMG) Gua Musang·Kelantan 3 barang −13.3% vs kebangsaan
 MYDIN WHOLESALE HYPERMARKET ALOR SETAR Kota Setar·Kedah 3 barang −11.1% vs kebangsaan MYDIN SUNGAI PETANI Kuala Muda·Kedah 3 barang −11.1% vs kebangsaan MYDIN KULIM HYPERMARKET Kulim·Kedah 3 barang −11.1% vs kebangsaan
 SABASUN HYPERRUNCIT SDN. BHD. Dungun·Terengganu 2 barang −11.1% vs kebangsaan
 PASARAYA PANTAI TIMUR BUKIT BUNGA Tanah Merah·Kelantan 3 barang −10.7% vs kebangsaan
 XR MART (910719X) Kuala Terengganu·Terengganu 2 barang −10.1% vs kebangsaan
 PASARAYA PANTAI TIMOR (PASIR PUTEH) SDN BHD Pasir Puteh·Kelantan 2 barang −10.1% vs kebangsaan
 ECONSAVE CASH & CARRY (KUBANG KERIAN) SDN.BHD Kota Bharu·Kelantan 3 barang −9.9% vs kebangsaan
Stores selling this category’s items below the national average, sorted by the largest gap.
Latest Eggs prices in Malaysia (Fresh Produce): 3 types tracked across 4 states for the week of 9 November 2026. Kedah has the lowest prices (−5.3% vs national).
Weekly trend: prices in this category are 1.1% lower than last week.
Cheapest in Kedah (−5.3% vs national); most expensive in Sarawak (+15.5%).
Main subcategories: Chicken Eggs (3).
Weekly Trend — State × Subcategory
| Kedah | −1% |
|---|---|
| Kelantan | −1.7% |
| Sarawak | +0.1% |
| Terengganu | −1.4% |
Each cell: the change in that subcategory’s average price in that state versus last week. Green = down, red = up.
% Difference from National Average — State × Subcategory
| Kedah | −5.3% |
|---|---|
| Kelantan | −4.3% |
| Sarawak | +15% |
| Terengganu | −3.6% |
Each cell: the average percentage difference of every item in that subcategory in that state versus the national price. Green = lower, red = higher.
% Difference from National Average — Store Type × Subcategory
| Grocery Store | +7.4% |
|---|---|
| Hypermarket | −2.8% |
| Minimart | +7.8% |
| Supermarket | −2% |
| Wet Market | +5.8% |
Each cell: the average percentage difference of every item in that subcategory at that store type versus the national price. Store types with the most locations are listed first.
vs National is computed as the average per-item percentage difference, so it is not skewed by the differing mix of items across states or store types. The matrix above shows the first 8 subcategories by item count; other subcategories are available in the Subcategories grid above.