Meat
Weekly trend and coverage of 20 items across 3 subcategories in 16 states.
Item List
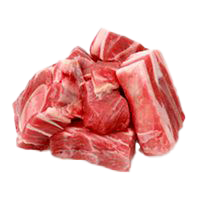
imported bone-in mutton (Australia, boxed)
RM 35.12 /1kg Goat Meat (Mutton)▼ RM 1.65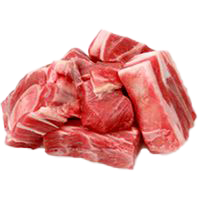
imported bone-in mutton (New Zealand, boxed)
RM 34.23 /1kg Goat Meat (Mutton)▲ RM 0.56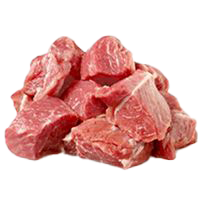
imported boneless mutton (excl. leg, Australia)
RM 50.37 /1kg Goat Meat (Mutton)▲ RM 1.62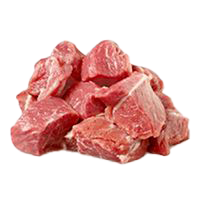
imported boneless mutton (excl. leg, New Zealand)
RM 50.17 /1kg Goat Meat (Mutton)▲ RM 0.26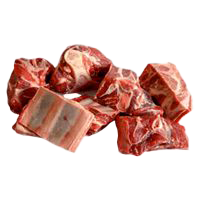
local bone-in mutton
RM 58.83 /1kg Goat Meat (Mutton)▼ RM 0.92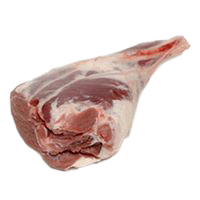
imported bone-in mutton leg (Australia)
RM 39.30 /1kg Goat Meat (Mutton)▼ RM 0.48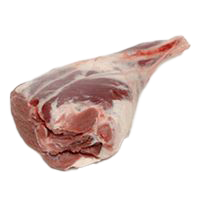
imported bone-in mutton leg (New Zealand)
RM 39.46 /1kg Goat Meat (Mutton)▲ RM 0.03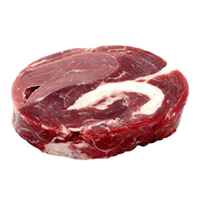
imported buffalo meat (India, block)
RM 24.70 /1kg Buffalo Meat▲ RM 0.11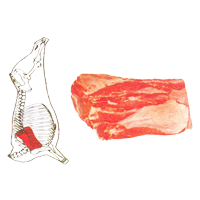
imported buffalo meat (India, blade)
RM 25.22 /1kg Buffalo Meat▼ RM 0.05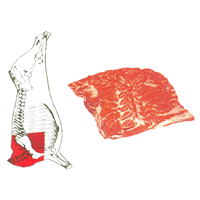
imported buffalo meat (India, chuck)
RM 26.37 /1kg Buffalo Meat▲ RM 0.23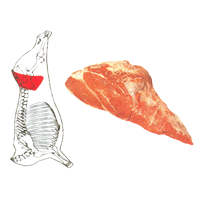
imported buffalo meat (India, rump)
RM 24.50 /1kg Buffalo Meat▲ RM 0.05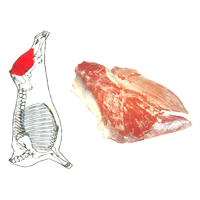
imported buffalo meat (India, silverside)
RM 24.69 /1kg Buffalo MeatBy Subcategory
Sorted from the largest weekly drop to the biggest rise
Best Value for Meat
 WAN LEE HENG CASH & CARRY ( KEPONG ) Kepong·W.P. Kuala Lumpur 5 barang −12.6% vs kebangsaan
 ST ROSYAM MART Setiawangsa·W.P. Kuala Lumpur 5 barang −11.9% vs kebangsaan PASARAYA BHUIYEN K CHOWKIT Titiwangsa·W.P. Kuala Lumpur 5 barang −11.3% vs kebangsaan
 V SEGAR MART Kinta·Perak 8 barang −10.6% vs kebangsaan
 NSK GROCER ( QUILL CITY MALL ) Bukit Bintang·W.P. Kuala Lumpur 8 barang −10.1% vs kebangsaan
 SEGI FRESH PUTRAJAYA PRESINT 15 Wp Putrajaya·W.P. Putrajaya 5 barang −9.7% vs kebangsaan NSK GROCER AMCORP MALL Petaling Jaya·Selangor 8 barang −9.1% vs kebangsaan ST.ROSYAM MART JAKEL SQUARE Bukit Bintang·W.P. Kuala Lumpur 9 barang −9.0% vs kebangsaan
Stores selling this category’s items below the national average, sorted by the largest gap.
Latest Meat prices in Malaysia (Fresh Produce): 20 types tracked across 16 states for the week of 2 November 2026. Kelantan has the lowest prices (−10.3% vs national).
Weekly trend: category prices are almost unchanged this week.
Cheapest in Kelantan (−10.3% vs national); most expensive in W.P. Putrajaya (+15.0%).
Main subcategories: Goat Meat (Mutton) (7), Beef (7), Buffalo Meat (6).
Weekly Trend — State × Subcategory
| Johor | −3.2% | +1% | +0.1% |
|---|---|---|---|
| Kedah | −4.1% | −0.6% | +0.8% |
| Kelantan | 0% | 0% | 0% |
| Melaka | −2.2% | 0% | +0.7% |
| Negeri Sembilan | −2% | 0% | +0.4% |
| Pahang | 0% | +0.6% | |
| Perak | −1.6% | +0.7% | 0% |
| Perlis | 0% | 0% | −0.4% |
| Pulau Pinang | −2.9% | +1.3% | +1% |
| Sabah | −0.5% | +0.1% | |
| Sarawak | −1.6% | +0.5% | 0% |
| Selangor | |||
| Terengganu | −2.1% | 0% | +0.5% |
| W.P. Kuala Lumpur | −2% | 0% | +0.2% |
| W.P. Labuan | 0% | ||
| W.P. Putrajaya | +0.1% | +1.1% |
Each cell: the change in that subcategory’s average price in that state versus last week. Green = down, red = up.
% Difference from National Average — State × Subcategory
| Johor | −4.2% | +7.5% | −1.9% |
|---|---|---|---|
| Kedah | −1.8% | −19% | −1.3% |
| Kelantan | −15% | −23% | −5.3% |
| Melaka | −0.9% | +7.2% | −2.3% |
| Negeri Sembilan | −2.2% | +4% | −5.4% |
| Pahang | +3.7% | −3% | |
| Perak | −0.8% | +18% | −1.6% |
| Perlis | −2.5% | −15% | −12% |
| Pulau Pinang | +6.8% | +6.4% | −5.4% |
| Sabah | −12% | −9.9% | +3.9% |
| Sarawak | +7.3% | +1.1% | +8.8% |
| Selangor | +3.9% | +9% | −1.7% |
| Terengganu | +1.3% | −15% | −5.9% |
| W.P. Kuala Lumpur | +3.3% | −20% | −4.2% |
| W.P. Labuan | +8.5% | ||
| W.P. Putrajaya | −9.9% | +31% | +4% |
Each cell: the average percentage difference of every item in that subcategory in that state versus the national price. Green = lower, red = higher.
% Difference from National Average — Store Type × Subcategory
| Grocery Store | −4.3% | +14% | −1.5% |
|---|---|---|---|
| Hypermarket | −6.6% | +31% | +1.6% |
| Minimart | −9.4% | −8.5% | +0.3% |
| Supermarket | −5.5% | +2.9% | +0.5% |
| Wet Market | +1.8% | −17% | −3.1% |
Each cell: the average percentage difference of every item in that subcategory at that store type versus the national price. Store types with the most locations are listed first.
vs National is computed as the average per-item percentage difference, so it is not skewed by the differing mix of items across states or store types. The matrix above shows the first 8 subcategories by item count; other subcategories are available in the Subcategories grid above.