Wangsa Maju
Price coverage of 51 items at 12 locations in the Wangsa Maju district.
Item List
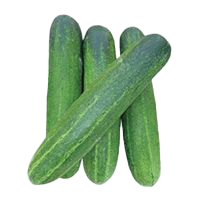
cucumber
RM 7.49 /1kg SAYUR-SAYURAN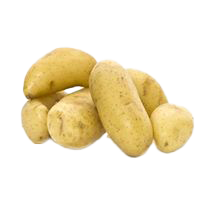
Holland potato
RM 3.00 /1kg UBI KENTANG
flower crab (5-8 per kg)
RM 46.65 /1kg BAHAN LAUT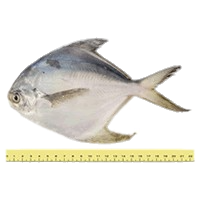
white pomfret (2-5 per kg)
RM 59.12 /1kg BAHAN LAUT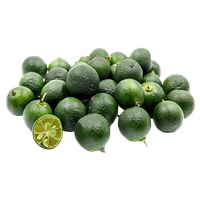
calamansi
RM 9.72 /1kg SAYUR-SAYURAN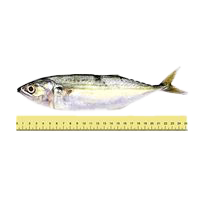
mabung fish (6-10 per kg)
RM 22.79 /1kg BAHAN LAUT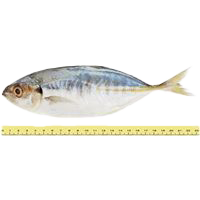
yellowtail scad (pelata, <=7 per kg)
RM 19.78 /1kg BAHAN LAUT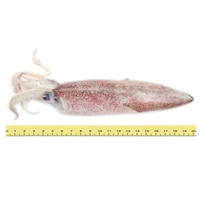
squid (>=6 per kg)
RM 41.58 /1kg BAHAN LAUT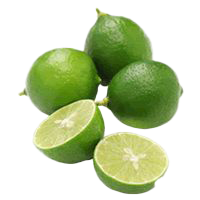
lime
RM 8.78 /1kg BUAH-BUAHAN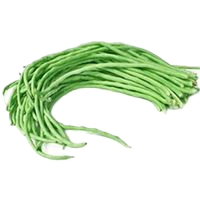
long beans
RM 11.10 /1kg SAYUR-SAYURAN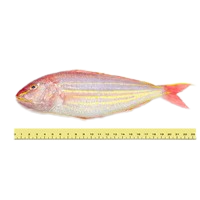
threadfin bream (5-10 per kg)
RM 18.10 /1kg BAHAN LAUT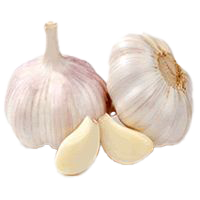
imported garlic (China)
RM 10.96 /1kg BAWANGBiggest Savings in Wangsa Maju
 MY MYDIN ( DANAU SAUJANA ) Wangsa Maju·W.P. Kuala Lumpur 37 barang −15.9% vs district average PASAR JALAN GENTING KLANG Wangsa Maju·W.P. Kuala Lumpur 37 barang −13.2% vs district average
 SUPER SEVEN TRADE CENTRE (KLTS) Wangsa Maju·W.P. Kuala Lumpur 46 barang −12.7% vs district average
 WHOLE FOODS EXPRESS Wangsa Maju·W.P. Kuala Lumpur 39 barang −3.1% vs district average TANI SEGAR SDN BHD (TANI FRESH MARKET) Wangsa Maju·W.P. Kuala Lumpur 41 barang −1.4% vs district average
 AEON BIG ( DANAU KOTA ) Wangsa Maju·W.P. Kuala Lumpur 37 barang −2.8% vs district average
 PASARAYA ONG TAI KIM ( WANGSA MAJU ) Wangsa Maju·W.P. Kuala Lumpur 45 barang −3.8% vs district average
 MEMI ZOOO ZOOO GROCER, JALAN GOMBAK Wangsa Maju·W.P. Kuala Lumpur 34 barang −4.6% vs district average AEON ( WANGSA MAJU ) Wangsa Maju·W.P. Kuala Lumpur 43 barang −13.4% vs district average
Stores selling items below the Wangsa Maju district average, sorted by the widest gap.
The Wangsa Maju district in W.P. Kuala Lumpur has 12 locations tracking 51 items for the week of 9 November 2026. On average, prices in Wangsa Maju are 8.2% higher than the national average.
Compared with the W.P. Kuala Lumpur average, Wangsa Maju is 1.3% cheaper.
Urban area · main chains: AEON, SUPER SEVEN, ONG TAI KIM.
By Category Group
% Difference from the District Average — Chain × Category Group
| AEON | +11% | −1.3% |
|---|---|---|
| INDIE | −13% | +1.5% |
| MEMI ZOOO ZOOO | +6.1% | −2.5% |
| MYDIN | −15% | −19% |
| ONG TAI KIM | +5.7% | −8.5% |
| SUPER SEVEN | −14% | −7.1% |
| THE STORE | +29% | +18% |
| WELL MART | +13% | +36% |
| WHOLE FOODS | −1.9% | −14% |
Each cell: the average percentage difference of every item in that group at that chain against the district average for the same item. Chains with the most locations are listed first.
% Difference from the District Average — Store Type × Category Group
| Supermarket | +2% | −1.1% |
|---|---|---|
| Wet Market | −19% | +15% |
Each cell: the average percentage difference of every item in that group at that store type against the district average for the same item. The 8 store types with the most locations are shown.
vs National is computed as the average percentage difference of each item, so it is not skewed by differing item mixes across chains or store types. vs State Average compares each item against the state average price for the same item. The cheapest-store list uses the district average price reference for each item.