Seremban
Price coverage of 54 items at 16 locations in the Seremban district.
Item List
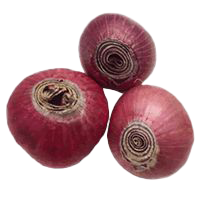
imported large onion (Pakistan)
RM 5.00 /1kg BAWANG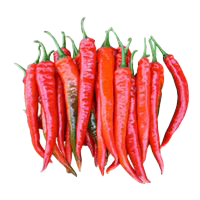
red chilli (Kulai)
RM 20.67 /1kg SAYUR-SAYURAN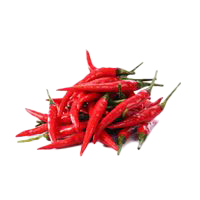
red chilli (akar variety)
RM 12.43 /1kg SAYUR-SAYURAN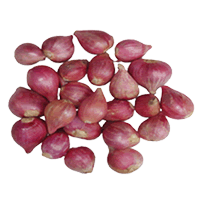
imported red shallot (China)
RM 4.30 /1kg BAWANG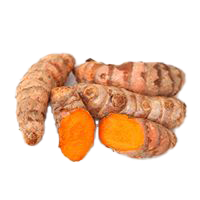
fresh turmeric
RM 8.11 /1kg SAYUR-SAYURAN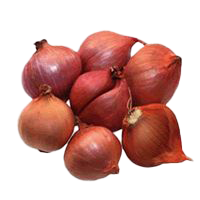
imported red shallot (Thailand)
RM 10.65 /1kg BAWANG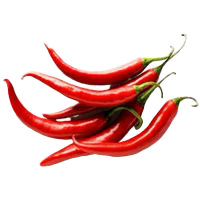
red chilli (minyak variety)
RM 11.54 /1kg SAYUR-SAYURAN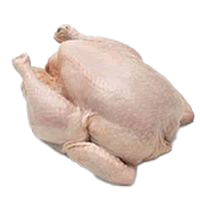
cleaned chicken (super grade)
RM 9.90 /1kg AYAM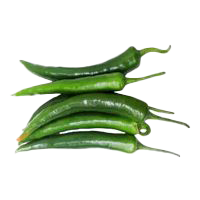
green chilli
RM 12.36 /1kg SAYUR-SAYURAN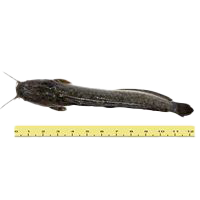
catfish (keli, 2-5 per kg)
RM 8.80 /1kg IKAN DARAT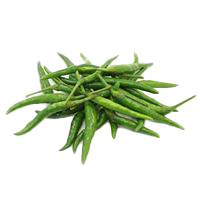
green chilli (akar variety)
RM 10.74 /1kg SAYUR-SAYURAN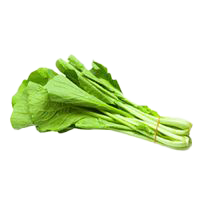
green mustard greens
RM 6.54 /1kg SAYUR-SAYURANBiggest Savings in Seremban
 PASARAYA ECONSAVE FOREST HEIGHT Seremban·Negeri Sembilan 41 barang −17.4% vs district average
 LOTUS'S SEREMBAN 2 Seremban·Negeri Sembilan 42 barang −14.5% vs district average LOTUS'S SEREMBAN JAYA Seremban·Negeri Sembilan 38 barang −13.7% vs district average
 FAMILY STORE SIKAMAT Seremban·Negeri Sembilan 44 barang −11.9% vs district average
 MYDIN SEREMBAN 2 Seremban·Negeri Sembilan 44 barang −9.7% vs district average FAMILY STORE SEREMBAN 2 Seremban·Negeri Sembilan 45 barang −9.4% vs district average PASARAYA CS GROCER NILAI Seremban·Negeri Sembilan 45 barang −5.4% vs district average
 GIANT NILAI Seremban·Negeri Sembilan 41 barang −4.0% vs district average GIANT SENAWANG Seremban·Negeri Sembilan 44 barang −3.9% vs district average PASAR BESAR SEREMBAN Seremban·Negeri Sembilan 49 barang −0.7% vs district average
Stores selling items below the Seremban district average, sorted by the widest gap.
The Seremban district in Negeri Sembilan has 16 locations tracking 54 items for the week of 9 November 2026. On average, prices in Seremban are 5.7% lower than the national average.
Compared with the Negeri Sembilan average, Seremban is 2.8% cheaper.
Urban area · main chains: FAMILY STORE, GIANT, LOTUS.
By Category Group
% Difference from the District Average — Chain × Category Group
| AEON | +29% | +28% |
|---|---|---|
| BIG 10 | +7% | −12% |
| ECONSAVE | −16% | −29% |
| FAMILY STORE | −8.8% | −1.9% |
| GIANT | −3.3% | −6.6% |
| GRAND UNION | +22% | +24% |
| INDIE | +6.2% | +12% |
| LOTUS | −15% | −8.6% |
| MYDIN | −7.5% | −24% |
| SEGI | +15% | +13% |
Each cell: the average percentage difference of every item in that group at that chain against the district average for the same item. Chains with the most locations are listed first.
% Difference from the District Average — Store Type × Category Group
| Hypermarket | −7.6% | −9.5% |
|---|---|---|
| Supermarket | +0.6% | +0.8% |
| Wet Market | +13% | +20% |
Each cell: the average percentage difference of every item in that group at that store type against the district average for the same item. The 8 store types with the most locations are shown.
vs National is computed as the average percentage difference of each item, so it is not skewed by differing item mixes across chains or store types. vs State Average compares each item against the state average price for the same item. The cheapest-store list uses the district average price reference for each item.