Kunak
Price coverage of 165 items at 6 locations in the Kunak district.
Item List

pineapple (Josapine/Morris/Sarawak)
RM 8.50 /1 biji BUAH-BUAHAN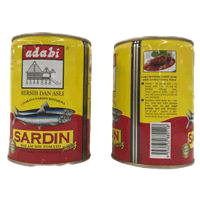
sardines in tomato sauce with chilli (Adabi)
RM 2.50 /425 g IKAN DALAM TIN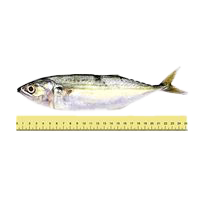
mabung fish (6-10 per kg)
RM 6.00 /1kg BAHAN LAUT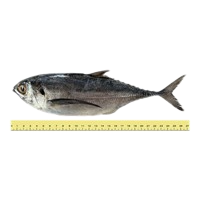
hardtail scad (4-6 per kg)
RM 3.90 /1kg BAHAN LAUT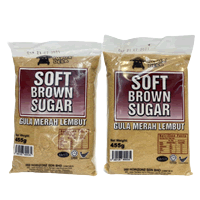
soft brown sugar (various brands)
RM 5.32 /+- 500g GULA
flower crab (5-8 per kg)
RM 19.00 /1kg BAHAN LAUT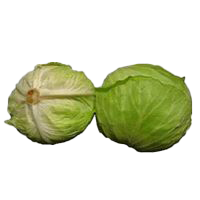
local round cabbage
RM 7.75 /1kg SAYUR-SAYURAN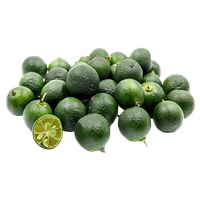
calamansi
RM 5.00 /1kg SAYUR-SAYURAN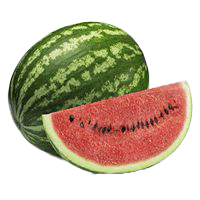
red watermelon (seeded)
RM 3.20 /1kg BUAH-BUAHAN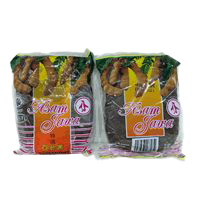
tamarind, with seeds (various brands)
RM 2.00 /200 g REMPAH RATUS (BERBUNGKUS)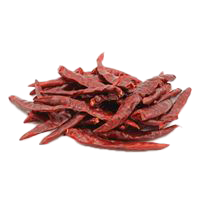
dried flat chilli (with/without stalk)
RM 14.95 /1kg CILI KERING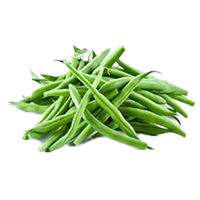
French beans
RM 8.49 /1kg SAYUR-SAYURANBiggest Savings in Kunak
 BATARAS SUPERSTORE KUNAK Kunak·Sabah 113 barang −5.2% vs district average
 STHAMIN SUPERMARKET KUNAK Kunak·Sabah 77 barang −0.3% vs district average
 SERVAY JAYA KUNAK S/B Kunak·Sabah 100 barang −0.5% vs district average
 PASARAYA SIONG HO Kunak·Sabah 106 barang −0.9% vs district average
 MOKTAR TRADING Kunak·Sabah 39 barang −4.7% vs district average PASAR UMUM KUNAK Kunak·Sabah 26 barang −8.9% vs district average
Stores selling items below the Kunak district average, sorted by the widest gap.
The Kunak district in Sabah has 6 locations tracking 165 items for the week of 16 November 2026. On average, prices in Kunak are on par with the national average.
Compared with the Sabah average, Kunak is 3.6% cheaper.
Rural area · main chains: BATARAS, SIONG HO, SERVAY.
By Category Group
% Difference from the District Average — Chain × Category Group
| BATARAS | −4.2% | −3.8% | −5.6% | −2.7% | −16% | −5.5% |
|---|---|---|---|---|---|---|
| INDIE | +6.9% | +17% | ||||
| MOKTAR | +4.5% | +3.4% | +8.1% | +3% | ||
| SERVAY | +3.9% | −9.2% | +3.3% | −1% | −12% | +8.3% |
| SIONG HO | −1.5% | +10% | −1% | −1% | +11% | +1.8% |
| STHAMIN | +0.2% | −3.4% | +3.2% | −0.6% | +4.9% | −2.3% |
Each cell: the average percentage difference of every item in that group at that chain against the district average for the same item. Chains with the most locations are listed first.
% Difference from the District Average — Store Type × Category Group
| Grocery Store | +4.5% | +3.4% | +8.1% | +3% | ||
|---|---|---|---|---|---|---|
| Supermarket | −0.4% | −2.2% | 0% | −1.3% | −2.6% | 0% |
| Wet Market | +6.9% | +17% |
Each cell: the average percentage difference of every item in that group at that store type against the district average for the same item. The 8 store types with the most locations are shown.
vs National is computed as the average percentage difference of each item, so it is not skewed by differing item mixes across chains or store types. vs State Average compares each item against the state average price for the same item. The cheapest-store list uses the district average price reference for each item.