Sandakan
Price coverage of 185 items at 20 locations in the Sandakan district.
Item List
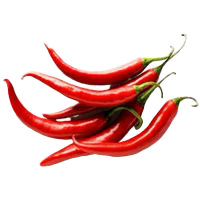
red chilli (minyak variety)
RM 32.50 /1kg SAYUR-SAYURAN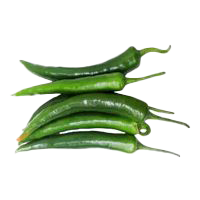
green chilli
RM 31.70 /1kg SAYUR-SAYURAN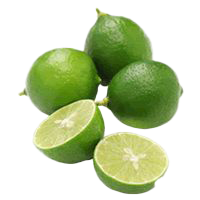
lime
RM 14.45 /1kg BUAH-BUAHAN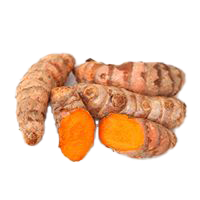
fresh turmeric
RM 19.37 /1kg SAYUR-SAYURAN
Indian mackerel (8-12 per kg)
RM 4.50 /1kg BAHAN LAUT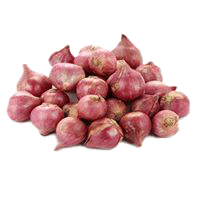
imported red shallot, regular (India)
RM 8.20 /1kg BAWANG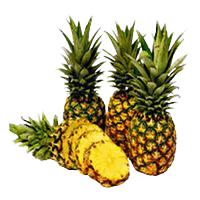
pineapple (Josapine/Morris/Sarawak)
RM 7.90 /1 biji BUAH-BUAHAN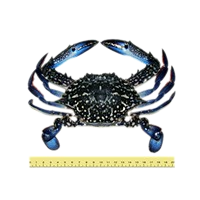
flower crab (5-8 per kg)
RM 13.50 /1kg BAHAN LAUT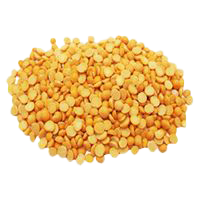
dhal (Australia)
RM 7.88 /1kg KACANG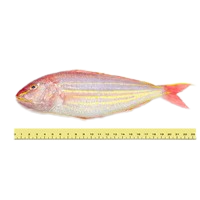
threadfin bream (5-10 per kg)
RM 6.75 /1kg BAHAN LAUT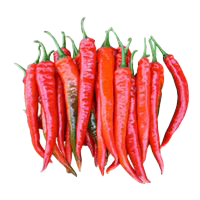
red chilli (Kulai)
RM 25.21 /1kg SAYUR-SAYURAN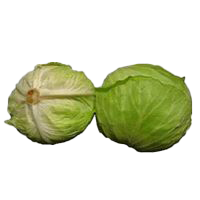
local round cabbage
RM 7.65 /1kg SAYUR-SAYURANBiggest Savings in Sandakan
 ECONSAVE CASH & CARRY (EM) SDN. BHD. Sandakan·Sabah 121 barang −6.2% vs district average
 BATARAS HYPERMARKET SANDAKAN Sandakan·Sabah 129 barang −6.0% vs district average
 GENTINGMAS MALL SDN. BHD Sandakan·Sabah 32 barang −3.8% vs district average GENTINGMAS MALL SDN BHD (BANDAR PERDANA) Sandakan·Sabah 59 barang −3.5% vs district average
 MYDIN SEJATI HYPERMARKET Sandakan·Sabah 110 barang −3.4% vs district average
 SERVAY EVERGREEN SDN BHD Sandakan·Sabah 71 barang −3.4% vs district average SERVAY HYPERMARKET SANDAKAN Sandakan·Sabah 118 barang −3.3% vs district average PASAR BASAH SIBUGA BT 8 Sandakan·Sabah 33 barang −2.9% vs district average
 PARKWELL DEPARTMENTAL STORE SANDAKAN Sandakan·Sabah 104 barang −2.7% vs district average MU GROCER Sandakan·Sabah 39 barang −1.3% vs district average
Stores selling items below the Sandakan district average, sorted by the widest gap.
The Sandakan district in Sabah has 20 locations tracking 185 items for the week of 16 November 2026. On average, prices in Sandakan are 4.4% higher than the national average.
Compared with the Sabah average, Sandakan is 1.0% more expensive.
Suburban area · main chains: SERVAY, GENTINGMAS, BATARAS.
By Category Group
% Difference from the District Average — Chain × Category Group
| BATARAS | −4.1% | −5.8% | −4.9% | −4.6% | −3% | −26% |
|---|---|---|---|---|---|---|
| ECONSAVE | −4.4% | −5.9% | −6% | −11% | −3.9% | −15% |
| GEMILANG | +1.5% | −2.7% | +3.9% | +2.9% | +0.6% | +13% |
| GENTINGMAS | +0.9% | −4.3% | +5.3% | −9.7% | −2.7% | −26% |
| INDIE | +1.2% | +5.5% | +3.4% | +3.1% | +1.2% | +15% |
| MU SUPERSTORE | −0.6% | 0% | −4.8% | +5% | +0.4% | −7.5% |
| MYDIN | +0.1% | −11% | +1.7% | −0.3% | −3.1% | −11% |
| PARKWELL | −1.5% | −8.5% | −4% | +1.6% | −0.8% | −3.5% |
| SERVAY | −0.5% | −7.6% | −3.4% | −1.7% | +0.8% | −18% |
Each cell: the average percentage difference of every item in that group at that chain against the district average for the same item. Chains with the most locations are listed first.
% Difference from the District Average — Store Type × Category Group
| Hypermarket | −0.8% | −6.4% | −1.1% | −3.9% | −1.6% | −19% |
|---|---|---|---|---|---|---|
| Minimart | +4.3% | +18% | +17% | +69% | +2% | +9.3% |
| Supermarket | −0.4% | +4.4% | −2% | +1.5% | +0.5% | +2.5% |
| Wet Market | −6.2% | +33% |
Each cell: the average percentage difference of every item in that group at that store type against the district average for the same item. The 8 store types with the most locations are shown.
vs National is computed as the average percentage difference of each item, so it is not skewed by differing item mixes across chains or store types. vs State Average compares each item against the state average price for the same item. The cheapest-store list uses the district average price reference for each item.