Marang
Price coverage of 171 items at 10 locations in the Marang district.
Item List

red chilli (minyak variety)
RM 9.35 /1kg SAYUR-SAYURAN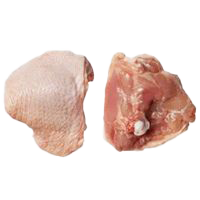
chicken thigh
RM 17.00 /1kg AYAM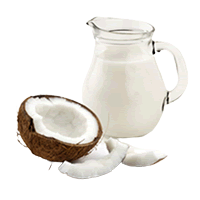
fresh coconut cream (regular)
RM 14.00 /1kg KELAPA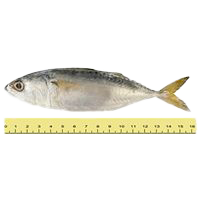
small Indian mackerel / yellowstripe scad (10-18 per kg)
RM 10.00 /1kg BAHAN LAUT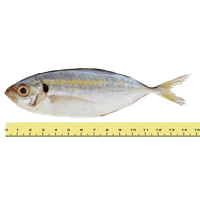
yellowtail scad (yellow, >=11 per kg)
RM 8.67 /1kg BAHAN LAUT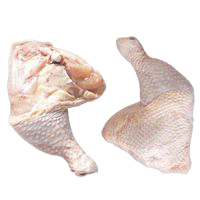
chicken whole leg
RM 19.90 /1kg AYAM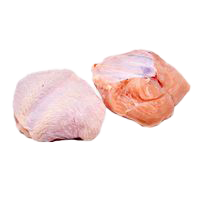
chicken breast (keel)
RM 17.00 /1kg AYAM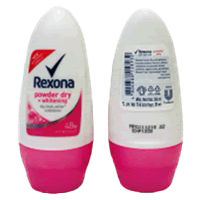
Rexona deodorant (Powder Dry Brightening)
RM 12.90 /50 ml PENJAGAAN DIRI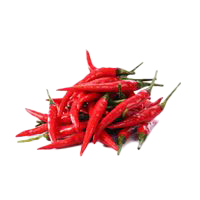
red chilli (akar variety)
RM 13.58 /1kg SAYUR-SAYURAN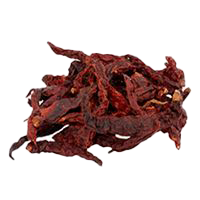
dried curly chilli (with/without stalk)
RM 27.00 /1kg CILI KERING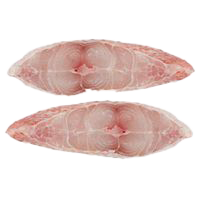
red snapper (slices)
RM 45.00 /1kg BAHAN LAUT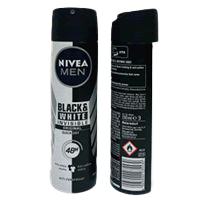
Nivea Men deodorant (Black & White Invisible, original)
RM 22.90 /150 ml PENJAGAAN DIRIBiggest Savings in Marang
 PASARAYA PXR WAKAF TAPAI Marang·Terengganu 125 barang −5.2% vs district average PASARAYA SERI INTAN SDN. BHD. Marang·Terengganu 47 barang −5.1% vs district average PASAR BUKIT PAYUNG Marang·Terengganu 73 barang −1.0% vs district average ABD WAHAB ABD KADIR (RHU MUDA) Marang·Terengganu 62 barang −0.6% vs district average PASARAYA SINAR MEGA Marang·Terengganu 61 barang −0.1% vs district average PASARAYA MARANG (TR0048869-K) Marang·Terengganu 72 barang −0.5% vs district average PASAR BESAR MARANG Marang·Terengganu 66 barang −2.0% vs district average PASAR WAKAF TAPAI Marang·Terengganu 66 barang −2.1% vs district average ANSAR MART Marang·Terengganu 79 barang −5.4% vs district average OCO MART Marang·Terengganu 46 barang −5.8% vs district average
Stores selling items below the Marang district average, sorted by the widest gap.
The Marang district in Terengganu has 10 locations tracking 171 items for the week of 16 November 2026. On average, prices in Marang are 2.0% higher than the national average.
Compared with the Terengganu average, Marang is 2.6% more expensive.
Suburban area · main chains: PXR.
By Category Group
% Difference from the District Average — Chain × Category Group
| INDIE | +0.3% | +1.4% | +0.6% | +2.7% | ||
|---|---|---|---|---|---|---|
| PXR | −1.1% | −15% | −3.3% | −17% | 0% | 0% |
Each cell: the average percentage difference of every item in that group at that chain against the district average for the same item. Chains with the most locations are listed first.
% Difference from the District Average — Store Type × Category Group
| Grocery Store | −1.1% | +11% | +1.3% | −0.3% | ||
|---|---|---|---|---|---|---|
| Minimart | −0.3% | +5.9% | −0.5% | −17% | ||
| Supermarket | −1.1% | −15% | −3.3% | −17% | 0% | 0% |
| Wet Market | +5.6% | −2.3% | +12% |
Each cell: the average percentage difference of every item in that group at that store type against the district average for the same item. The 8 store types with the most locations are shown.
vs National is computed as the average percentage difference of each item, so it is not skewed by differing item mixes across chains or store types. vs State Average compares each item against the state average price for the same item. The cheapest-store list uses the district average price reference for each item.