BILLION
Price coverage of 50 items at 15 locations across 5 states.
Item List
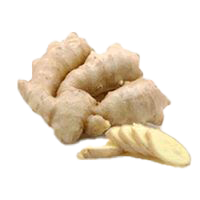
fresh ginger (old)
RM 4.47 /1kg SAYUR-SAYURAN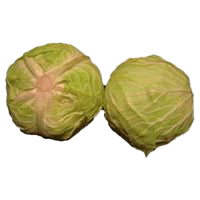
imported round cabbage (China)
RM 1.60 /1kg SAYUR-SAYURAN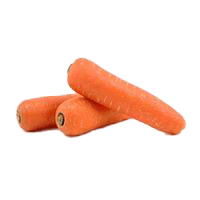
carrot
RM 2.27 /1kg SAYUR-SAYURAN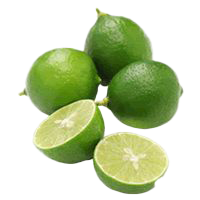
lime
RM 4.89 /1kg BUAH-BUAHAN
imported round cabbage (Beijing)
RM 3.34 /1kg SAYUR-SAYURAN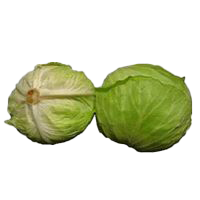
local round cabbage
RM 3.77 /1kg SAYUR-SAYURAN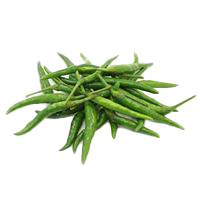
green chilli (akar variety)
RM 9.55 /1kg SAYUR-SAYURAN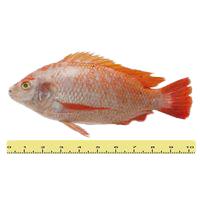
red tilapia (2-5 per kg)
RM 13.35 /1kg IKAN DARAT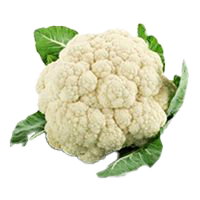
cauliflower
RM 6.48 /1kg SAYUR-SAYURAN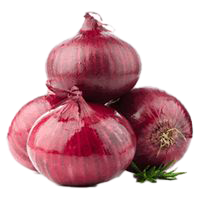
imported large onion (China)
RM 3.99 /1kg BAWANG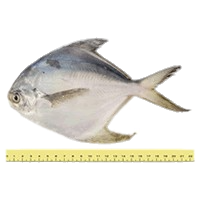
white pomfret (2-5 per kg)
RM 41.96 /1kg BAHAN LAUT
green chilli
RM 11.56 /1kg SAYUR-SAYURANBy State
Sorted from cheapest to priciest against the national average
Biggest Savings — BILLION
 BILLION SHOPPING CENTRE (KOTA PERMAI) SDN BHD Seberang Perai Tengah·Pulau Pinang 40 barang −18.0% vs national BILLION PARIT BUNTAR Kerian·Perak 34 barang −17.9% vs national PASARAYA BILLION Segamat·Johor 41 barang −17.3% vs national BILLION SHOPPING CENTRE SEBERANG JAYA Seberang Perai Tengah·Pulau Pinang 37 barang −15.9% vs national BILLION BALING Baling·Kedah 41 barang −15.4% vs national BILLION DUTY-FREE (LANGKAWI) SDN. BHD. Langkawi·Kedah 36 barang −14.3% vs national PASARAYA BILLION (ALOR SETAR) SDN BHD Kota Setar·Kedah 33 barang −13.7% vs national BILLION SHOPPING CENTRE Seberang Perai Utara·Pulau Pinang 34 barang −13.7% vs national BILLION MART TANJONG CHAT Kota Bharu·Kelantan 36 barang −12.6% vs national BILLION JELAPANG Kinta·Perak 42 barang −12.4% vs national
Branches selling items below the national average, sorted by the widest gap.
BILLION tracks 50 items at 15 locations across 5 states for the week of 9 November 2026. On average its prices are 11.3% lower than the national average.
Cheapest in Johor (−17.3% vs national); most expensive in Kelantan (−6.1%).
Main groups: Fresh Produce (42), Dry Goods (8).
By Category Group
% Difference from the National Average — State × Category Group
| Johor | −19% | −5.1% |
|---|---|---|
| Kedah | −11% | −8.3% |
| Kelantan | −6.5% | −3.3% |
| Perak | −15% | −1% |
| Pulau Pinang | −14% | −16% |
Each cell: the average percentage difference of every item in that group in that state against the national price for the same item.
vs National is computed as the average percentage difference of each item against the national average, so it is not skewed by differing item mixes. Each matrix cell: the average difference of items in that group in that state against the national price.