TMG
Price coverage of 47 items at 29 locations across 6 states.
Item List

cucumber
RM 7.21 /1kg SAYUR-SAYURAN
flower crab (5-8 per kg)
RM 46.72 /1kg BAHAN LAUT
Indian mackerel (8-12 per kg)
RM 19.98 /1kg BAHAN LAUT
carrot
RM 2.86 /1kg SAYUR-SAYURAN
lime
RM 5.66 /1kg BUAH-BUAHAN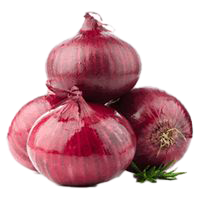
imported large onion (China)
RM 4.00 /1kg BAWANG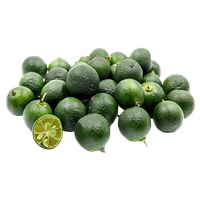
calamansi
RM 9.43 /1kg SAYUR-SAYURAN
fresh turmeric
RM 8.23 /1kg SAYUR-SAYURAN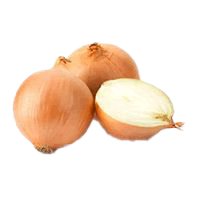
large onion (yellow / Holland)
RM 3.42 /1kg BAWANG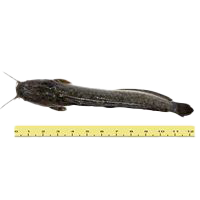
catfish (keli, 2-5 per kg)
RM 12.06 /1kg IKAN DARAT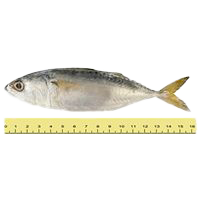
small Indian mackerel / yellowstripe scad (10-18 per kg)
RM 16.94 /1kg BAHAN LAUT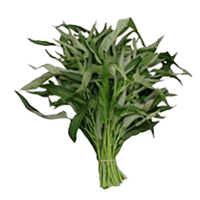
water spinach
RM 5.20 /1kg SAYUR-SAYURANBy State
Sorted from cheapest to priciest against the national average
Biggest Savings — TMG
 TUNAS MANJA (MUADZAM SHAH) SDN. BHD. Rompin·Pahang 38 barang −9.0% vs national TUNAS MANJA TEMERLOH Temerloh·Pahang 39 barang −8.8% vs national PASARAYA TUNAS MANJA Mersing·Johor 39 barang −8.4% vs national TMG MART 16 Kuantan·Pahang 38 barang −5.8% vs national TUNAS MANJA SUPERMARKET (BANDAR MUADZAM SHAH) SDN BHD Rompin·Pahang 36 barang −5.4% vs national TUNAS MANJA SDN BHD (PETRON) Jerantut·Pahang 40 barang −4.6% vs national TUNAS MANJA SUPERMARKET (KEMAMAN) S.B Kemaman·Terengganu 37 barang −4.5% vs national TUNAS MANJA RAUB Raub·Pahang 38 barang −4.4% vs national TMG MART ( KEPONG PRIMA ) Kepong·W.P. Kuala Lumpur 29 barang −4.0% vs national TUNAS MANJA SDN BHD (TRANSIT POINT) Kuantan·Pahang 40 barang −3.7% vs national
Branches selling items below the national average, sorted by the widest gap.
TMG tracks 47 items at 29 locations across 6 states for the week of 9 November 2026. On average its prices are 0.9% lower than the national average.
Cheapest in Johor (−3.6% vs national); most expensive in W.p. Kuala Lumpur (+0.2%).
Main groups: Fresh Produce (40), Dry Goods (7).
By Category Group
% Difference from the National Average — State × Category Group
| Johor | −2.6% | −9.6% |
|---|---|---|
| Kelantan | −5.3% | +7.4% |
| Pahang | −1.8% | −0.3% |
| Selangor | −1% | −6% |
| Terengganu | −1.7% | −1.7% |
| W.P. Kuala Lumpur | +1.8% | −12% |
Each cell: the average percentage difference of every item in that group in that state against the national price for the same item.
vs National is computed as the average percentage difference of each item against the national average, so it is not skewed by differing item mixes. Each matrix cell: the average difference of items in that group in that state against the national price.