VILLAGE GROCER
Price coverage of 48 items at 11 locations across 2 states.
Item List
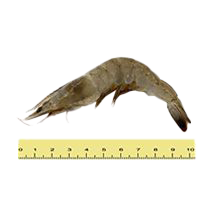
white prawn / vannamei (farmed, 41-60 per kg)
RM 65.90 /1kg BAHAN LAUT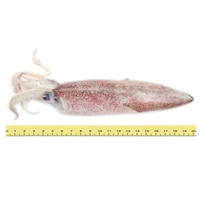
squid (>=6 per kg)
RM 66.57 /1kg BAHAN LAUT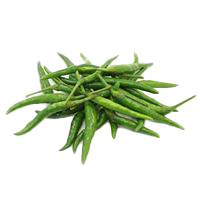
green chilli (akar variety)
RM 23.21 /1kg SAYUR-SAYURAN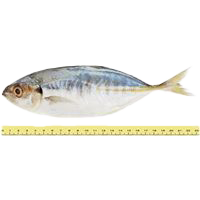
yellowtail scad (pelata, <=7 per kg)
RM 30.36 /1kg BAHAN LAUT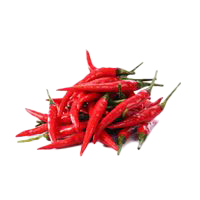
red chilli (akar variety)
RM 30.28 /1kg SAYUR-SAYURAN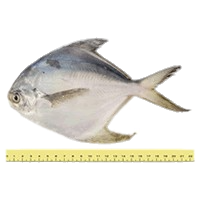
white pomfret (2-5 per kg)
RM 88.65 /1kg BAHAN LAUT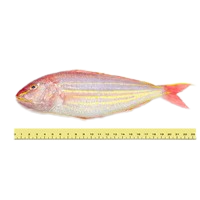
threadfin bream (5-10 per kg)
RM 26.76 /1kg BAHAN LAUT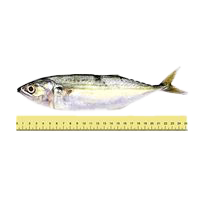
mabung fish (6-10 per kg)
RM 32.36 /1kg BAHAN LAUT
Indian mackerel (8-12 per kg)
RM 27.90 /1kg BAHAN LAUT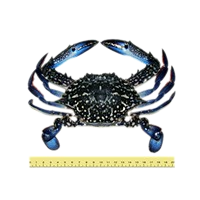
flower crab (5-8 per kg)
RM 61.90 /1kg BAHAN LAUT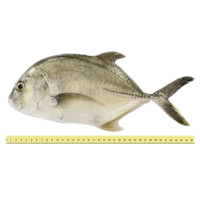
ponyfish (demuduk/cupak/cermin, <=3 per kg)
RM 46.90 /1kg BAHAN LAUT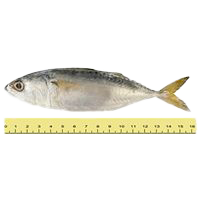
small Indian mackerel / yellowstripe scad (10-18 per kg)
RM 23.91 /1kg BAHAN LAUTBy State
Sorted from cheapest to priciest against the national average
Biggest Savings — VILLAGE GROCER
 VILLAGE GROCER ( LEISURE MALL ) Cheras·W.P. Kuala Lumpur 32 barang −23.4% vs national VILLAGE GROCER KIARA BAY Kepong·W.P. Kuala Lumpur 29 barang −25.4% vs national VILLAGE GROCER ( EKO CHERAS ) Cheras·W.P. Kuala Lumpur 34 barang −27.1% vs national VILLAGE GROCER (AVENUE K) Bukit Bintang·W.P. Kuala Lumpur 34 barang −27.3% vs national VILLAGE GROCER @ MYTOWN Cheras·W.P. Kuala Lumpur 35 barang −28.4% vs national VILLAGE GROCER ( KL GATEWAY MALL ) Lembah Pantai·W.P. Kuala Lumpur 30 barang −28.8% vs national VILLAGE GROCER LSH33 Batu·W.P. Kuala Lumpur 31 barang −31.2% vs national VILLAGE GROCER ( SRI HARTAMAS ) Segambut·W.P. Kuala Lumpur 33 barang −31.7% vs national VILLAGE GROCER (TAMARIND SQUARE) CYBERJAYA Cyberjaya·W.P. Putrajaya 36 barang −33.6% vs national VILLAGE GROCER ( DESA PARK ARKADIA ) Segambut·W.P. Kuala Lumpur 31 barang −33.6% vs national
Branches selling items below the national average, sorted by the widest gap.
VILLAGE GROCER tracks 48 items at 11 locations across 2 states for the week of 9 November 2026. On average its prices are 34.1% higher than the national average.
Cheapest in W.p. Kuala Lumpur (+33.3% vs national); most expensive in W.p. Putrajaya (+33.6%).
Main groups: Fresh Produce (40), Dry Goods (8).
By Category Group
% Difference from the National Average — State × Category Group
| W.P. Kuala Lumpur | +38% | +12% |
|---|---|---|
| W.P. Putrajaya | +36% | +16% |
Each cell: the average percentage difference of every item in that group in that state against the national price for the same item.
vs National is computed as the average percentage difference of each item against the national average, so it is not skewed by differing item mixes. Each matrix cell: the average difference of items in that group in that state against the national price.