99 SPEEDMART
Price coverage of 72 items at 122 locations across 11 states.
Item List
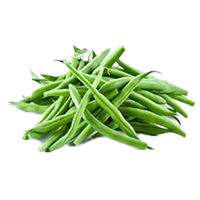
French beans
RM 19.00 /1kg SAYUR-SAYURAN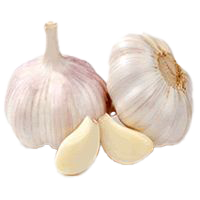
imported garlic (China)
RM 6.02 /1kg BAWANG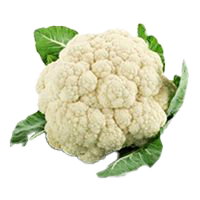
cauliflower
RM 11.36 /1kg SAYUR-SAYURAN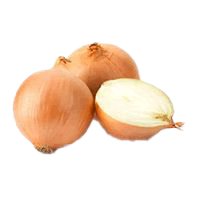
large onion (yellow / Holland)
RM 2.95 /1kg BAWANG
Maggi tomato sauce
RM 5.50 /325 g KICAP DAN SOS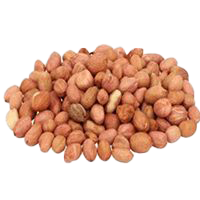
imported peanuts
RM 12.22 /1kg KACANG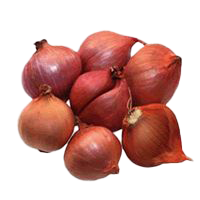
imported red shallot (Thailand)
RM 9.66 /1kg BAWANG
okra
RM 11.72 /1kg SAYUR-SAYURAN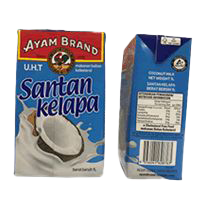
Ayam Brand coconut cream (boxed)
RM 11.33 /1 liter SANTAN (KOTAK)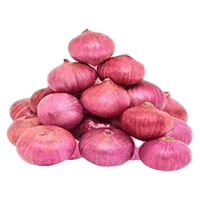
imported large onion (India)
RM 3.26 /1kg BAWANG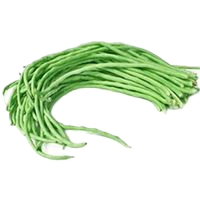
long beans
RM 11.58 /1kg SAYUR-SAYURAN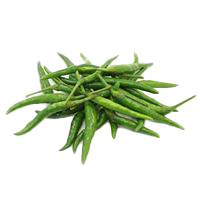
green chilli (akar variety)
RM 15.48 /1kg SAYUR-SAYURANBy State
Sorted from cheapest to priciest against the national average
Biggest Savings — 99 SPEEDMART
 99 SPEEDMART 2403 (PG) TAMAN CHAI LENG Seberang Perai Tengah·Pulau Pinang 32 barang −8.8% vs national 99 SPEEDMART SEK 16 SHAH ALAM Petaling·Selangor 35 barang −8.1% vs national 99 SPEEDMART CHANGKAT JONG Hilir Perak·Perak 43 barang −7.4% vs national 99 SPEED MART (CAWANGAN TENANG) Segamat·Johor 33 barang −7.2% vs national 99 SPEED MART (JLN TIONG NAM) Bukit Bintang·W.P. Kuala Lumpur 26 barang −7.2% vs national 99 SPEEDMART SDN BHD TAMAN MEGA Segamat·Johor 35 barang −7.1% vs national 99 SPEEDMART SEK 7 SHAH ALAM Petaling·Selangor 39 barang −7.1% vs national 99 SPEEDMART SALAK TINGGI Sepang·Selangor 35 barang −6.9% vs national 99 SPEEDMART KOSMOPLEKS Sepang·Selangor 37 barang −6.6% vs national 99 SPEEDMART SG GEDONG Kerian·Perak 32 barang −6.5% vs national
Branches selling items below the national average, sorted by the widest gap.
99 SPEEDMART tracks 72 items at 122 locations across 11 states for the week of 2 November 2026. On average its prices are 2.7% lower than the national average.
Cheapest in Terengganu (−6.4% vs national); most expensive in Selangor (−2.3%).
Main groups: Packaged Goods (46), Milk and Baby Products (9), Fresh Produce (9).
By Category Group
% Difference from the National Average — State × Category Group
| Johor | −6.1% | −5% | +21% | −14% |
|---|---|---|---|---|
| Kedah | −6.6% | −5% | +23% | −13% |
| Negeri Sembilan | −6.9% | −5% | +19% | −11% |
| Pahang | −5.1% | −4.9% | +18% | −12% |
| Perak | −6.4% | −5% | +17% | −14% |
| Perlis | −6.4% | −5.1% | +21% | +9.3% |
| Pulau Pinang | −6.5% | −4.7% | +23% | −9.8% |
| Selangor | −6% | −4.7% | +27% | −8.5% |
| Terengganu | −6.9% | −5.8% | −3.2% | −3.5% |
| W.P. Kuala Lumpur | −6.1% | −5.2% | −1.1% | −11% |
| W.P. Putrajaya | −7.8% | −5.4% | −3.2% | +13% |
Each cell: the average percentage difference of every item in that group in that state against the national price for the same item.
vs National is computed as the average percentage difference of each item against the national average, so it is not skewed by differing item mixes. Each matrix cell: the average difference of items in that group in that state against the national price.