AEON
Price coverage of 235 items at 32 locations across 10 states.
Item List

imported soybeans
RM 15.05 /1kg KACANG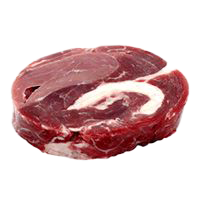
imported beef (block)
RM 63.90 /1kg DAGING
imported peanuts
RM 17.18 /1kg KACANG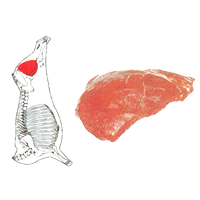
imported beef (topside)
RM 84.90 /1kg DAGING
broccoli
RM 20.00 /1kg SAYUR-SAYURAN
dhal (Australia)
RM 8.18 /1kg KACANG
dried squid (medium size)
RM 180.00 /1kg HASIL LAUT KERING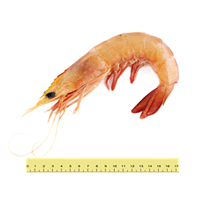
large white prawn (20-30 per kg)
RM 89.90 /1kg BAHAN LAUT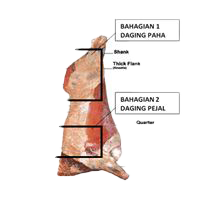
local beef (part 1: leg meat, excl. tenderloin)
RM 56.90 /1kg DAGING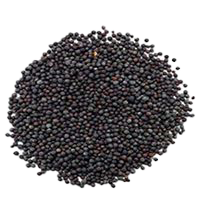
mustard seeds
RM 2.37 /100 g REMPAH RATUS (TIDAK BERBUNGKUS)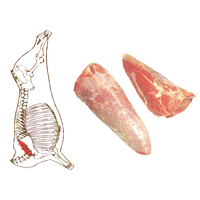
imported beef (chuck tender)
RM 81.40 /1kg DAGING
water spinach
RM 9.53 /1kg SAYUR-SAYURANBy State
Sorted from cheapest to priciest against the national average
Biggest Savings — AEON
 AEON BIG SEKSYEN 23 Petaling·Selangor 177 barang −2.2% vs national AEON BIG KAPAR Klang·Selangor 174 barang −2.2% vs national AEON BIG BUKIT TENGAH Seberang Perai Tengah·Pulau Pinang 162 barang −2.6% vs national AEON BIG ( WANGSA MAJU ) Setiawangsa·W.P. Kuala Lumpur 155 barang −2.6% vs national AEON BIG (KLUANG) Kluang·Johor 156 barang −2.7% vs national AEON BIG SEKSYEN 32 Petaling·Selangor 157 barang −3.1% vs national AEON BIG FALIM Kinta·Perak 165 barang −3.2% vs national AEON BIG ( KEPONG ) Kepong·W.P. Kuala Lumpur 172 barang −3.4% vs national PASARAYA HYPERMARKET AEON BIG Batu Pahat·Johor 178 barang −3.9% vs national AEON BIG ( MID VALLEY ) Lembah Pantai·W.P. Kuala Lumpur 151 barang −4.0% vs national
Branches selling items below the national average, sorted by the widest gap.
AEON tracks 235 items at 32 locations across 10 states for the week of 2 November 2026. On average its prices are 10.5% higher than the national average.
Cheapest in Pulau Pinang (+2.6% vs national); most expensive in Kelantan (+13.0%).
Main groups: Fresh Produce (86), Packaged Goods (85), Hygiene Products (18).
By Category Group
% Difference from the National Average — State × Category Group
| Johor | +0.7% | +15% | +0.3% | +7.3% | +2.2% | +28% |
|---|---|---|---|---|---|---|
| Kelantan | +2.6% | +34% | +0.6% | +11% | +3.3% | +33% |
| Melaka | +0.5% | +15% | +0.4% | +7.2% | +4.6% | +30% |
| Negeri Sembilan | −0.1% | +21% | +1% | +6.1% | +0.9% | +9.5% |
| Perak | +1.5% | +24% | +0.9% | +9.6% | +3% | +27% |
| Pulau Pinang | −1.4% | +4.7% | +0.3% | +9.1% | −2.2% | +20% |
| Sarawak | +5% | +28% | +12% | +11% | +1.9% | +3.3% |
| Selangor | −1% | +5.3% | −3.1% | +8.5% | +4.3% | +27% |
| W.P. Kuala Lumpur | +0.3% | +20% | +1% | +8.3% | +3.3% | +27% |
| W.P. Putrajaya | 0% | +19% | −0.5% | +6.9% | +0.3% | +32% |
Each cell: the average percentage difference of every item in that group in that state against the national price for the same item.
vs National is computed as the average percentage difference of each item against the national average, so it is not skewed by differing item mixes. Each matrix cell: the average difference of items in that group in that state against the national price.