BATARAS
Price coverage of 200 items at 19 locations across 2 states.
Item List
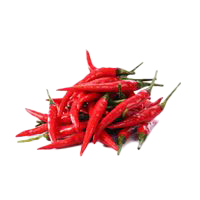
red chilli (akar variety)
RM 34.90 /1kg SAYUR-SAYURAN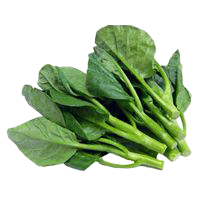
kai-lan (Chinese broccoli)
RM 22.50 /1kg SAYUR-SAYURAN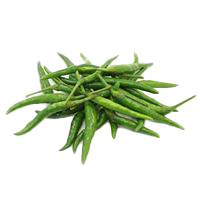
green chilli (akar variety)
RM 23.65 /1kg SAYUR-SAYURAN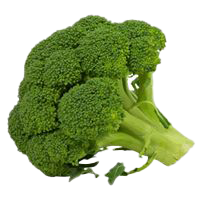
broccoli
RM 2.90 /1kg SAYUR-SAYURAN
green bird's eye chilli
RM 47.90 /1kg SAYUR-SAYURAN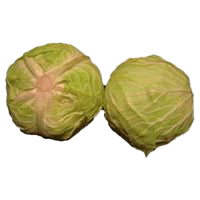
imported round cabbage (China)
RM 4.90 /1kg SAYUR-SAYURAN
red dragon fruit
RM 15.84 /1kg BUAH-BUAHAN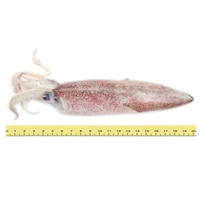
squid (>=6 per kg)
RM 18.99 /1kg BAHAN LAUT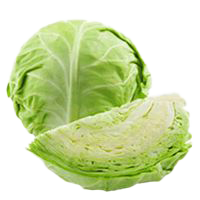
imported round cabbage (Beijing)
RM 6.77 /1kg SAYUR-SAYURAN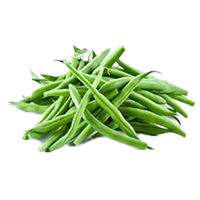
French beans
RM 6.83 /1kg SAYUR-SAYURAN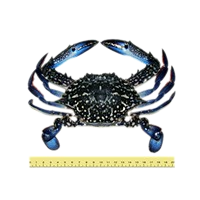
flower crab (5-8 per kg)
RM 21.43 /1kg BAHAN LAUT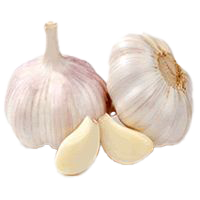
imported garlic (China)
RM 5.54 /1kg BAWANGBy State
Sorted from cheapest to priciest against the national average
Biggest Savings — BATARAS
 BATARAS SUPERSTORE (KOTA MARUDU) Kota Marudu·Sabah 111 barang −8.1% vs national BATARAS HYPERMARKET TAMPARULI Tamparuli·Sabah 122 barang −8.0% vs national BATARAS HYPERMARKET JALAN APAS Tawau·Sabah 111 barang −7.3% vs national BATARAS SUPERSTORE Kota Kinabalu·Sabah 120 barang −7.1% vs national BATARAS SUPERSTORE INANAM Kota Kinabalu·Sabah 139 barang −6.8% vs national BATARAS HYPERMARKET GRAND MERDEKA Kota Kinabalu·Sabah 135 barang −6.8% vs national BATARAS HYPERMARKET TAWAU Tawau·Sabah 108 barang −6.3% vs national BATARAS SUPERSTORE PAPAR Papar·Sabah 117 barang −5.8% vs national BATARAS SUPERSTORE Kudat·Sabah 88 barang −5.8% vs national BATARAS HYPERMARKET KOLOMBONG INANAM Kota Kinabalu·Sabah 141 barang −5.3% vs national
Branches selling items below the national average, sorted by the widest gap.
BATARAS tracks 200 items at 19 locations across 2 states for the week of 2 November 2026. On average its prices are 2.8% lower than the national average.
Cheapest in Sabah (−3.0% vs national); most expensive in W.p. Labuan (−1.7%).
Main groups: Packaged Goods (75), Fresh Produce (68), Beverages (15).
By Category Group
% Difference from the National Average — State × Category Group
| Sabah | −1.4% | −1.9% | −1.5% | −18% | −2.5% | −3.4% |
|---|---|---|---|---|---|---|
| W.P. Labuan | −1.8% | +3.7% | −0.1% | −16% | −1.7% | −7.7% |
Each cell: the average percentage difference of every item in that group in that state against the national price for the same item.
vs National is computed as the average percentage difference of each item against the national average, so it is not skewed by differing item mixes. Each matrix cell: the average difference of items in that group in that state against the national price.