ECONSAVE
Price coverage of 229 items at 69 locations across 13 states.
Item List
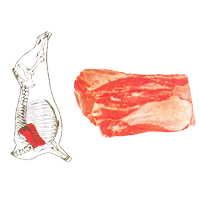
imported beef (blade)
RM 23.99 /1kg DAGING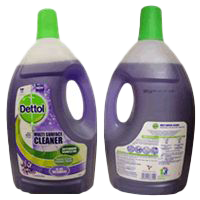
Dettol multi-purpose cleaner (lavender)
RM 11.90 /2.5 liter PENJAGAAN RUMAH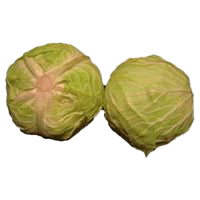
imported round cabbage (China)
RM 1.69 /1kg SAYUR-SAYURAN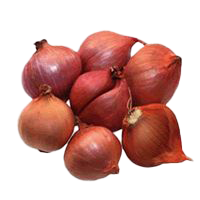
imported red shallot (Thailand)
RM 7.65 /1kg BAWANG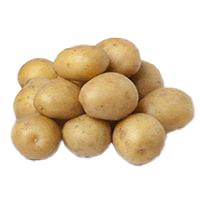
imported potato (China)
RM 1.88 /1kg UBI KENTANG
lime
RM 4.49 /1kg BUAH-BUAHAN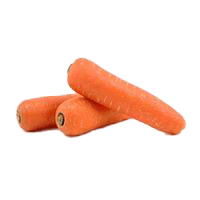
carrot
RM 2.39 /1kg SAYUR-SAYURAN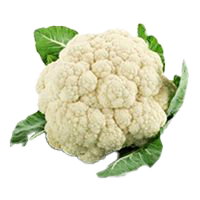
cauliflower
RM 5.40 /1kg SAYUR-SAYURAN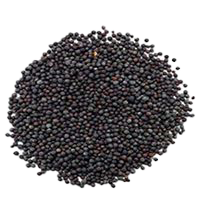
mustard seeds
RM 0.93 /100 g REMPAH RATUS (TIDAK BERBUNGKUS)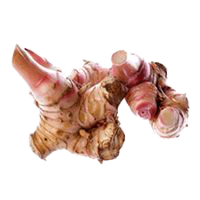
galangal
RM 6.75 /1kg SAYUR-SAYURAN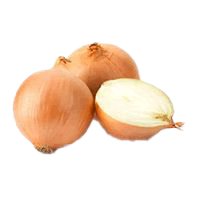
large onion (yellow / Holland)
RM 2.82 /1kg BAWANG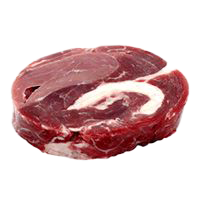
imported beef (block)
RM 23.99 /1kg DAGINGBy State
Sorted from cheapest to priciest against the national average
Biggest Savings — ECONSAVE
 PASARAYA ECONSAVE FOREST HEIGHT Seremban·Negeri Sembilan 167 barang −16.3% vs national ECONSAVE CASH AND CARRY MALIM S/B Melaka Tengah·Melaka 169 barang −15.2% vs national ECONSAVE KLUANG Kluang·Johor 151 barang −14.7% vs national PASARAYA ECONSAVE BAKRI MUAR Muar·Johor 158 barang −14.6% vs national ECONSAVE SERI ISKANDAR Perak Tengah·Perak 174 barang −14.5% vs national ECONSAVE JELAPANG Kinta·Perak 173 barang −14.3% vs national PASARAYA ECONSAVE SEGAMAT Segamat·Johor 155 barang −14.2% vs national PASARAYA ECONSAVE MUAR Muar·Johor 167 barang −14.1% vs national ECONSAVE CASH & CARRY (TPJ) SDN BHD Kuala Muda·Kedah 158 barang −14.1% vs national PASARAYA ECONSAVE KAPAR SDN BHD Klang·Selangor 154 barang −14.1% vs national
Branches selling items below the national average, sorted by the widest gap.
ECONSAVE tracks 229 items at 69 locations across 13 states for the week of 2 November 2026. On average its prices are 10.9% lower than the national average.
Cheapest in Melaka (−14.1% vs national); most expensive in Sarawak (−3.1%).
Main groups: Packaged Goods (86), Fresh Produce (82), Dry Goods (17).
By Category Group
% Difference from the National Average — State × Category Group
| Johor | −9% | −16% | −21% | −11% | −15% | −6.3% |
|---|---|---|---|---|---|---|
| Kedah | −9.1% | −17% | −17% | −11% | −17% | −5.7% |
| Kelantan | −8.4% | −17% | −17% | −9.7% | −14% | −6% |
| Melaka | −9.9% | −20% | −22% | −7.6% | −17% | −6.7% |
| Negeri Sembilan | −9.4% | −18% | −23% | −11% | −20% | −6.2% |
| Pahang | −8.9% | −17% | −20% | −10% | −10% | −5.9% |
| Perak | −8.6% | −16% | −10% | −8.6% | −13% | −6.2% |
| Pulau Pinang | −8.7% | −16% | −19% | −10% | −11% | −5.7% |
| Sabah | −2.2% | −3.4% | −11% | −1.3% | −6% | +0.5% |
| Sarawak | −0.5% | −2.7% | −17% | −3.4% | −4.2% | −2.9% |
| Selangor | −7.7% | −12% | −20% | −11% | −14% | −5.5% |
| Terengganu | −8.5% | −18% | −23% | −10% | −12% | −6.4% |
| W.P. Kuala Lumpur | −8.2% | −12% | −20% | −11% | −9.9% | −6.5% |
Each cell: the average percentage difference of every item in that group in that state against the national price for the same item.
vs National is computed as the average percentage difference of each item against the national average, so it is not skewed by differing item mixes. Each matrix cell: the average difference of items in that group in that state against the national price.