MASLEE
Price coverage of 205 items at 11 locations across 1 states.
Item List
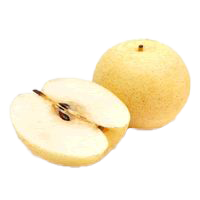
yellow lai (size M)
RM 3.49 /1 biji BUAH-BUAHAN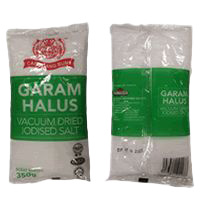
fine table salt (regular, various brands)
RM 1.95 /+-350g REMPAH RATUS (BERBUNGKUS)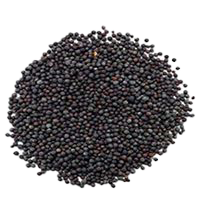
mustard seeds
RM 2.57 /100 g REMPAH RATUS (TIDAK BERBUNGKUS)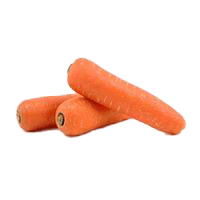
carrot
RM 2.12 /1kg SAYUR-SAYURAN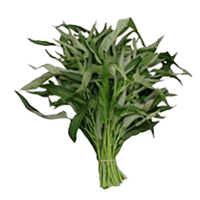
water spinach
RM 8.41 /1kg SAYUR-SAYURAN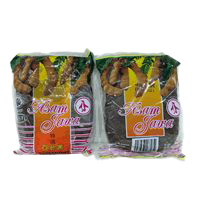
tamarind, with seeds (various brands)
RM 1.99 /200 g REMPAH RATUS (BERBUNGKUS)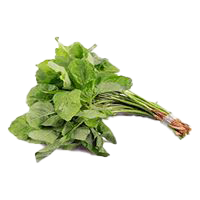
green spinach
RM 8.82 /1kg SAYUR-SAYURAN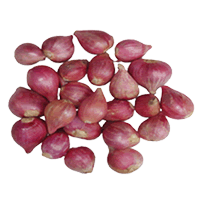
imported red shallot (China)
RM 3.99 /1kg BAWANG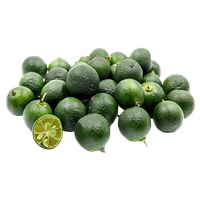
calamansi
RM 5.52 /1kg SAYUR-SAYURAN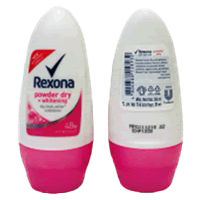
Rexona deodorant (Powder Dry Brightening)
RM 13.69 /50 ml PENJAGAAN DIRI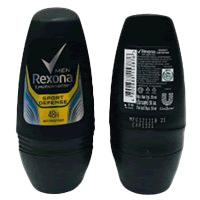
Rexona Men deodorant (Sport Defense)
RM 13.69 /50 ml PENJAGAAN DIRI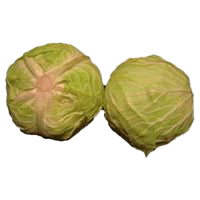
imported round cabbage (China)
RM 2.15 /1kg SAYUR-SAYURANBy State
Sorted from cheapest to priciest against the national average
Biggest Savings — MASLEE
 MASLEE EXPRESS BANDAR TENGGARA Kota Tinggi·Johor 144 barang −2.7% vs national MASLEE EXPRES B5 JOHOR STREET MARKET Johor Bahru·Johor 166 barang −0.6% vs national MASLEE EXPRESS KEMPAS Johor Bahru·Johor 172 barang −0.9% vs national MASLEE EXPRESS PEKAN NENAS Pontian·Johor 164 barang −0.9% vs national MASLEE EXPRESS TAMAN DAYA Johor Bahru·Johor 169 barang −1.3% vs national MASLEE WHOLESALE C & C (PONTIAN) S/B Pontian·Johor 166 barang −1.3% vs national MASLEE EXPRESS TAMAN TERATAI Johor Bahru·Johor 154 barang −1.7% vs national MASLEE EXPRESS KAMPUNG AMAN Johor Bahru·Johor 166 barang −2.0% vs national MASLEE LARKIN IDAMAN Johor Bahru·Johor 159 barang −2.3% vs national MASLEE EXPRESS TAMAN PULAI UTAMA Johor Bahru·Johor 137 barang −3.0% vs national
Branches selling items below the national average, sorted by the widest gap.
MASLEE tracks 205 items at 11 locations across 1 states for the week of 2 November 2026. On average its prices are 1.3% higher than the national average.
Cheapest in Johor (+1.3% vs national).
Main groups: Packaged Goods (81), Fresh Produce (71), Hygiene Products (15).
By Category Group
% Difference from the National Average — State × Category Group
| Johor | +3.1% | 0% | +8.1% | +1% | −12% | +3.1% |
|---|
Each cell: the average percentage difference of every item in that group in that state against the national price for the same item.
vs National is computed as the average percentage difference of each item against the national average, so it is not skewed by differing item mixes. Each matrix cell: the average difference of items in that group in that state against the national price.