NSK
Price coverage of 234 items at 11 locations across 5 states.
Item List
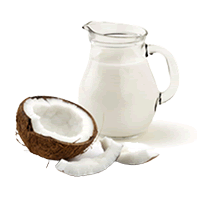
fresh coconut cream (thick)
RM 6.30 /1kg KELAPA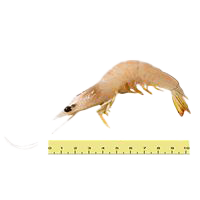
large white prawn / banana prawn (41-60 per kg)
RM 18.99 /1kg BAHAN LAUT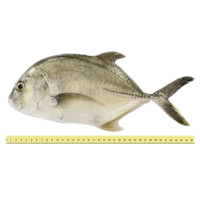
ponyfish (demuduk/cupak/cermin, <=3 per kg)
RM 13.80 /1kg BAHAN LAUT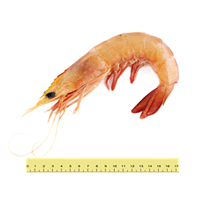
large white prawn (20-30 per kg)
RM 28.90 /1kg BAHAN LAUT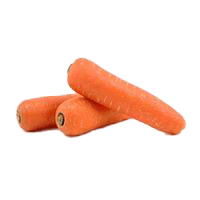
carrot
RM 2.18 /1kg SAYUR-SAYURAN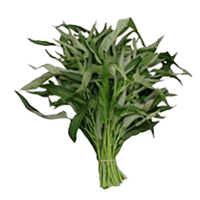
water spinach
RM 3.62 /1kg SAYUR-SAYURAN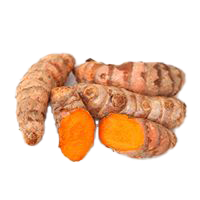
fresh turmeric
RM 6.13 /1kg SAYUR-SAYURAN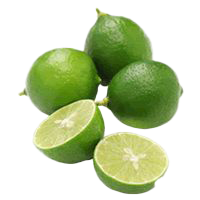
lime
RM 4.44 /1kg BUAH-BUAHAN
red chilli (minyak variety)
RM 8.71 /1kg SAYUR-SAYURAN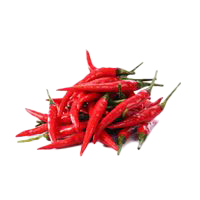
red chilli (akar variety)
RM 10.69 /1kg SAYUR-SAYURAN
green bird's eye chilli
RM 16.99 /1kg SAYUR-SAYURAN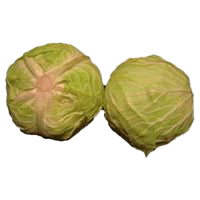
imported round cabbage (China)
RM 1.88 /1kg SAYUR-SAYURANBy State
Sorted from cheapest to priciest against the national average
Biggest Savings — NSK
 NSK TRADE CITY ( KUCHAI LAMA ) Seputeh·W.P. Kuala Lumpur 172 barang −10.3% vs national NSK TRADE CITY ( KEPONG ) Kepong·W.P. Kuala Lumpur 169 barang −9.5% vs national NSK TRADE CITY (PANDAN) SDN BHD Johor Bahru·Johor 173 barang −9.4% vs national NSK TRADE CITY ( JALAN PEEL ) Cheras·W.P. Kuala Lumpur 185 barang −9.2% vs national NSK TRADE CITY SDN BHD Tangkak·Johor 162 barang −9.0% vs national NSK TRADE CITY (MELAKA) SDN BHD Melaka Tengah·Melaka 177 barang −8.9% vs national NSK GROCER ( QUILL CITY MALL ) Bukit Bintang·W.P. Kuala Lumpur 166 barang −7.6% vs national NSK GROCER AMCORP MALL Petaling Jaya·Selangor 148 barang −7.2% vs national NSK GROCER ( TIMES SQUARE ) Bukit Bintang·W.P. Kuala Lumpur 134 barang −6.3% vs national NSK TOPZELLER Setiawangsa·W.P. Kuala Lumpur 161 barang −5.2% vs national
Branches selling items below the national average, sorted by the widest gap.
NSK tracks 234 items at 11 locations across 5 states for the week of 2 November 2026. On average its prices are 7.8% lower than the national average.
Cheapest in Johor (−9.1% vs national); most expensive in Negeri Sembilan (−5.1%).
Main groups: Fresh Produce (92), Packaged Goods (78), Hygiene Products (18).
By Category Group
% Difference from the National Average — State × Category Group
| Johor | −15% | −5.6% | −5.9% | −22% | +2% | +0.3% |
|---|---|---|---|---|---|---|
| Melaka | −15% | −5.4% | −7.6% | −14% | +1.3% | −0.8% |
| Negeri Sembilan | −12% | −1.3% | −1% | −6.8% | +1.6% | +5.9% |
| Selangor | −11% | −3.3% | −0.6% | −21% | +5.3% | +9.1% |
| W.P. Kuala Lumpur | −11% | −4.2% | −4% | −18% | +1.8% | +2.5% |
Each cell: the average percentage difference of every item in that group in that state against the national price for the same item.
vs National is computed as the average percentage difference of each item against the national average, so it is not skewed by differing item mixes. Each matrix cell: the average difference of items in that group in that state against the national price.