PASARAYA BS
Price coverage of 198 items at 8 locations across 2 states.
Item List
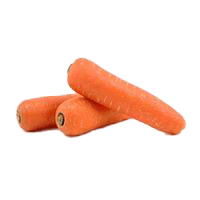
carrot
RM 2.02 /1kg SAYUR-SAYURAN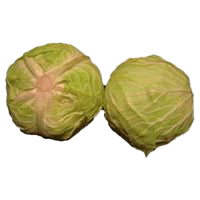
imported round cabbage (China)
RM 1.67 /1kg SAYUR-SAYURAN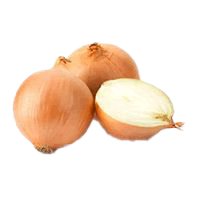
large onion (yellow / Holland)
RM 2.47 /1kg BAWANG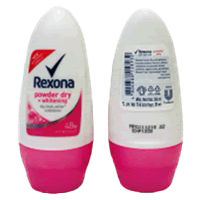
Rexona deodorant (Powder Dry Brightening)
RM 6.19 /50 ml PENJAGAAN DIRI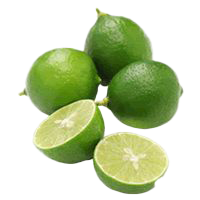
lime
RM 4.39 /1kg BUAH-BUAHAN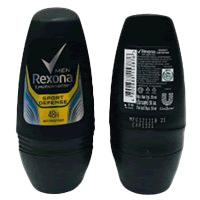
Rexona Men deodorant (Sport Defense)
RM 6.90 /50 ml PENJAGAAN DIRI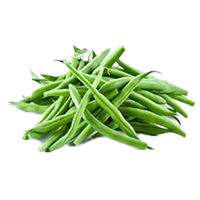
French beans
RM 7.97 /1kg SAYUR-SAYURAN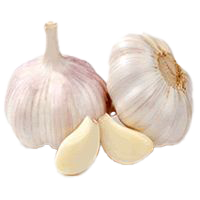
imported garlic (China)
RM 6.17 /1kg BAWANG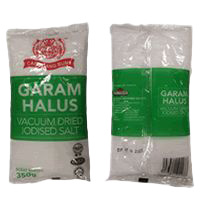
fine table salt (regular, various brands)
RM 0.72 /+-350g REMPAH RATUS (BERBUNGKUS)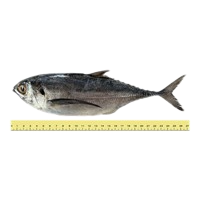
hardtail scad (4-6 per kg)
RM 7.72 /1kg BAHAN LAUT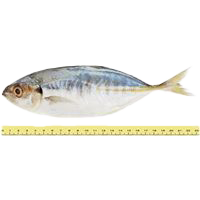
yellowtail scad (pelata, <=7 per kg)
RM 12.23 /1kg BAHAN LAUT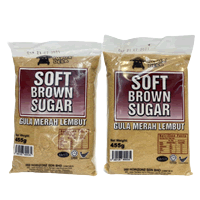
soft brown sugar (various brands)
RM 4.47 /+- 500g GULABy State
Sorted from cheapest to priciest against the national average
Biggest Savings — PASARAYA BS
 PASARAYA BS FRESH MART Bera·Pahang 152 barang −8.7% vs national PASARAYA BS (PJ) SDN BHD Lipis·Pahang 127 barang −7.1% vs national PASARAYA BS KUALA ROMPIN SDN. BHD. Rompin·Pahang 133 barang −7.1% vs national PASARAYA BS (PJ) SDN. BHD (CAWANGAN KEMAMAN) Kemaman·Terengganu 141 barang −5.8% vs national PASARAYA BS TANJONG GEMOK Rompin·Pahang 139 barang −4.8% vs national PASARAYA BS TEMERLOH SDN BHD Temerloh·Pahang 146 barang −4.7% vs national PASARAYA BS TEMERLOH SDN BHD (CAWANGAN MENTAKAB) Temerloh·Pahang 167 barang −4.7% vs national PASARAYA BS FRESH MART JERANTUT SDN BHD Jerantut·Pahang 149 barang −4.2% vs national
Branches selling items below the national average, sorted by the widest gap.
PASARAYA BS tracks 198 items at 8 locations across 2 states for the week of 2 November 2026. On average its prices are 5.7% lower than the national average.
Cheapest in Terengganu (−5.8% vs national); most expensive in Pahang (−5.8%).
Main groups: Packaged Goods (75), Fresh Produce (67), Hygiene Products (17).
By Category Group
% Difference from the National Average — State × Category Group
| Pahang | −1.6% | −8.5% | −9.1% | −6.1% | −0.4% | −15% |
|---|---|---|---|---|---|---|
| Terengganu | −1.1% | −13% | −1.5% | +2.3% | +1.3% | −20% |
Each cell: the average percentage difference of every item in that group in that state against the national price for the same item.
vs National is computed as the average percentage difference of each item against the national average, so it is not skewed by differing item mixes. Each matrix cell: the average difference of items in that group in that state against the national price.