SEGI
Price coverage of 172 items at 24 locations across 6 states.
Item List
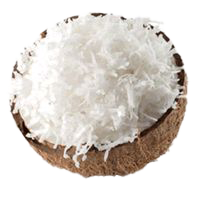
grated coconut
RM 19.95 /1kg KELAPA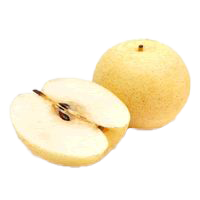
yellow lai (size M)
RM 2.92 /1 biji BUAH-BUAHAN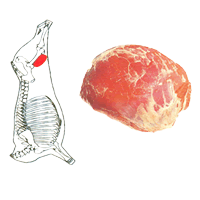
imported beef (knuckle)
RM 25.90 /1kg DAGING
green bird's eye chilli
RM 38.67 /1kg SAYUR-SAYURAN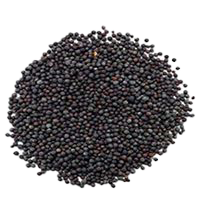
mustard seeds
RM 0.89 /100 g REMPAH RATUS (TIDAK BERBUNGKUS)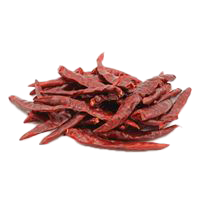
dried flat chilli (with/without stalk)
RM 32.14 /1kg CILI KERING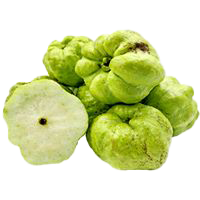
guava (seedless)
RM 13.98 /1kg BUAH-BUAHAN
dried squid (medium size)
RM 74.93 /1kg HASIL LAUT KERING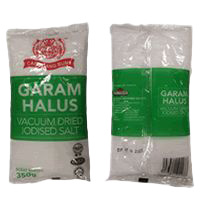
fine table salt (regular, various brands)
RM 0.75 /+-350g REMPAH RATUS (BERBUNGKUS)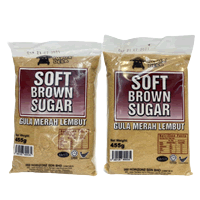
soft brown sugar (various brands)
RM 2.60 /+- 500g GULA
red grapes (seeded)
RM 13.91 /1kg BUAH-BUAHAN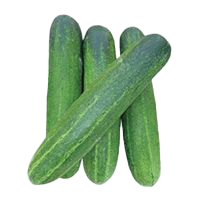
cucumber
RM 6.92 /1kg SAYUR-SAYURANBy State
Sorted from cheapest to priciest against the national average
Biggest Savings — SEGI
 SEGI FRESH TANJONG KARANG Kuala Selangor·Selangor 119 barang −2.6% vs national SEGI FRESH KUALA SELANGOR Kuala Selangor·Selangor 114 barang −2.2% vs national SEGI FRESH ARA DAMANSARA Petaling Jaya·Selangor 122 barang −1.0% vs national PASARAYA SEGI FRESH SEMENYIH Hulu Langat·Selangor 109 barang −0.7% vs national SEGI CASH & CARRY SDN BHD (GOMBAK) Gombak·Selangor 128 barang −0.5% vs national SEGI FRESH ( TAMAN SHAMELIN ) Cheras·W.P. Kuala Lumpur 131 barang −0.3% vs national SEGI FRESH SIKAMAT Seremban·Negeri Sembilan 132 barang −0.2% vs national SEGI FRESH PUTRAJAYA PRESINT 15 Wp Putrajaya·W.P. Putrajaya 129 barang −0.2% vs national SEGI CASH & CARRY TAPAH Batang Padang·Perak 125 barang −0.1% vs national SEGI CASH & CARRY SDN BHD Hilir Perak·Perak 111 barang −0.1% vs national
Branches selling items below the national average, sorted by the widest gap.
SEGI tracks 172 items at 24 locations across 6 states for the week of 2 November 2026. On average its prices are on par with the national average.
Cheapest in W.p. Kuala Lumpur (−0.2% vs national); most expensive in Perak (+1.1%).
Main groups: Fresh Produce (80), Packaged Goods (57), Dry Goods (14).
By Category Group
% Difference from the National Average — State × Category Group
| Kedah | +1.6% | −1.3% | +1.7% | +0.4% | ||
|---|---|---|---|---|---|---|
| Negeri Sembilan | +2.7% | −2.9% | −0.2% | −7.7% | +2.2% | −3.2% |
| Perak | +3.1% | −2.6% | +4.4% | −2.3% | +3.8% | +7.2% |
| Selangor | +2.1% | −1.9% | −1% | −2.3% | −2.3% | +5.6% |
| W.P. Kuala Lumpur | +1.1% | −2.2% | +1.2% | −1.8% | +4.4% | +0.4% |
| W.P. Putrajaya | −0.5% | −1.1% | +4.7% | −1.5% | +9.7% | +0.4% |
Each cell: the average percentage difference of every item in that group in that state against the national price for the same item.
vs National is computed as the average percentage difference of each item against the national average, so it is not skewed by differing item mixes. Each matrix cell: the average difference of items in that group in that state against the national price.