TF VALUE MART
Price coverage of 217 items at 30 locations across 9 states.
Item List
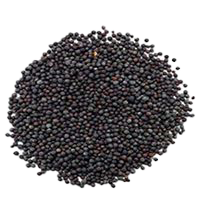
mustard seeds
RM 0.85 /100 g REMPAH RATUS (TIDAK BERBUNGKUS)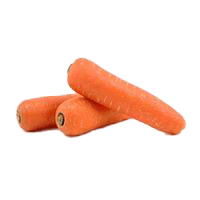
carrot
RM 2.38 /1kg SAYUR-SAYURAN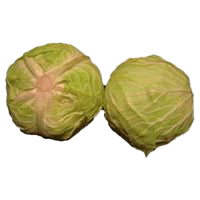
imported round cabbage (China)
RM 1.84 /1kg SAYUR-SAYURAN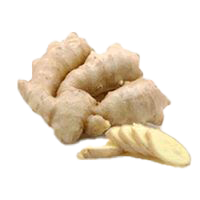
fresh ginger (old)
RM 5.80 /1kg SAYUR-SAYURAN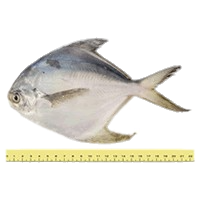
white pomfret (2-5 per kg)
RM 31.99 /1kg BAHAN LAUT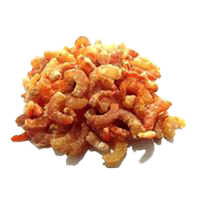
dried prawns
RM 11.09 /100 g HASIL LAUT KERING
green bird's eye chilli
RM 18.73 /1kg SAYUR-SAYURAN
lady finger banana
RM 5.24 /1kg BUAH-BUAHAN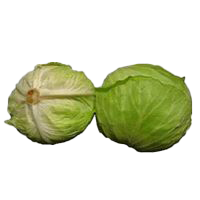
local round cabbage
RM 3.54 /1kg SAYUR-SAYURAN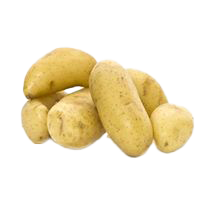
Holland potato
RM 2.99 /1kg UBI KENTANG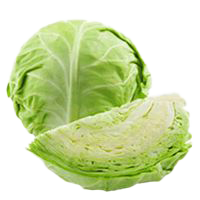
imported round cabbage (Beijing)
RM 3.39 /1kg SAYUR-SAYURAN
Rexona deodorant (Powder Dry Brightening)
RM 13.50 /50 ml PENJAGAAN DIRIBy State
Sorted from cheapest to priciest against the national average
Biggest Savings — TF VALUE MART
 TF VALUE MART SDN BHD SEGAMAT Segamat·Johor 137 barang −10.4% vs national TF VALUE MART PORT DICKSON Port Dickson·Negeri Sembilan 176 barang −5.8% vs national TF VALUE MART TAMBUN Kinta·Perak 179 barang −5.0% vs national TF VALUE MART GERIK Hulu Perak·Perak 193 barang −4.7% vs national TF VALUE MART RAUB Raub·Pahang 183 barang −4.6% vs national TF VALUE-MART BATU CAVES Gombak·Selangor 190 barang −4.3% vs national TF VALUE MART BATU GAJAH Kinta·Perak 193 barang −4.0% vs national TF VALUE MART SG SIPUT Kuala Kangsar·Perak 189 barang −3.9% vs national TF VALUE MART TAMAN MELOR Hilir Perak·Perak 176 barang −3.7% vs national TF VALUE MART ALOR SETAR Kota Setar·Kedah 182 barang −3.6% vs national
Branches selling items below the national average, sorted by the widest gap.
TF VALUE MART tracks 217 items at 30 locations across 9 states for the week of 2 November 2026. On average its prices are 3.7% lower than the national average.
Cheapest in Negeri Sembilan (−5.8% vs national); most expensive in Pahang (−2.9%).
Main groups: Fresh Produce (78), Packaged Goods (78), Hygiene Products (18).
By Category Group
% Difference from the National Average — State × Category Group
| Johor | −0.6% | −7.4% | +4.7% | −3.3% | −4.7% | −5.8% |
|---|---|---|---|---|---|---|
| Kedah | −1.4% | −8.3% | +6.3% | −3.4% | −2.7% | −5.9% |
| Kelantan | −1.3% | −7.3% | +4.4% | −1.5% | −1.2% | −7.8% |
| Negeri Sembilan | −0.8% | −14% | +1.4% | −3.1% | −5.8% | −9.6% |
| Pahang | −1% | −7.6% | +4.7% | −2.4% | −4% | −2.2% |
| Perak | −2.1% | −7.1% | +4.3% | −2.9% | −3.9% | −5.5% |
| Pulau Pinang | −1.1% | −7.5% | +5.8% | −7.8% | −4.2% | −5.4% |
| Selangor | −1.7% | −6.5% | +3.1% | −3.1% | −4.5% | −8.7% |
| W.P. Kuala Lumpur | −0.7% | −5.6% | +2.4% | −4.1% | −4.4% | −8.6% |
Each cell: the average percentage difference of every item in that group in that state against the national price for the same item.
vs National is computed as the average percentage difference of each item against the national average, so it is not skewed by differing item mixes. Each matrix cell: the average difference of items in that group in that state against the national price.