THE STORE
Price coverage of 199 items at 10 locations across 5 states.
Item List
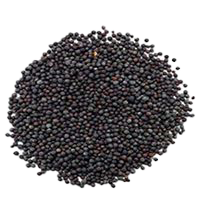
mustard seeds
RM 3.12 /100 g REMPAH RATUS (TIDAK BERBUNGKUS)
flower crab (5-8 per kg)
RM 59.90 /1kg BAHAN LAUT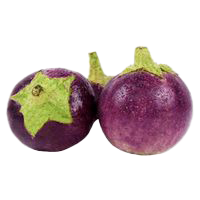
round eggplant
RM 13.45 /1kg SAYUR-SAYURAN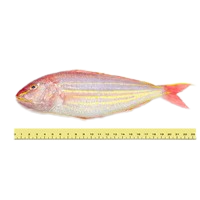
threadfin bream (5-10 per kg)
RM 24.45 /1kg BAHAN LAUT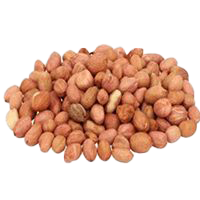
imported peanuts
RM 14.62 /1kg KACANG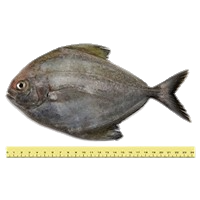
black pomfret (2-5 per kg)
RM 39.99 /1kg BAHAN LAUT
red chilli (akar variety)
RM 26.30 /1kg SAYUR-SAYURAN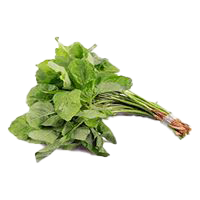
green spinach
RM 10.08 /1kg SAYUR-SAYURAN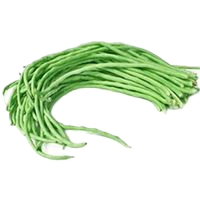
long beans
RM 13.98 /1kg SAYUR-SAYURAN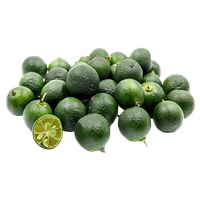
calamansi
RM 10.94 /1kg SAYUR-SAYURAN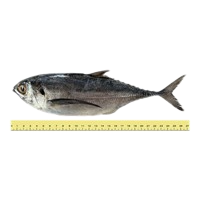
hardtail scad (4-6 per kg)
RM 14.95 /1kg BAHAN LAUT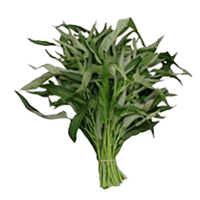
water spinach
RM 8.63 /1kg SAYUR-SAYURANBy State
Sorted from cheapest to priciest against the national average
Biggest Savings — THE STORE
 THE STORE MUAR Muar·Johor 117 barang −2.0% vs national THE STORE (KUALA KANGSAR) Kuala Kangsar·Perak 81 barang −0.5% vs national PASARAYA THE STORE (CAWANGAN JALAN RUGAYAH Batu Pahat·Johor 108 barang −2.5% vs national THE STORE TEMERLOH Temerloh·Pahang 102 barang −3.6% vs national THE STORE KAMUNTING Larut, Matang & Selama·Perak 140 barang −4.3% vs national PASARAYA THE STORE (MALAYSIA) Kangar·Perlis 119 barang −4.7% vs national THE STORE TELUK INTAN Hilir Perak·Perak 131 barang −6.6% vs national THE STORE ( SRI PETALING ) Seputeh·W.P. Kuala Lumpur 154 barang −8.4% vs national THE STORE ( PUDU PLAZA ) Cheras·W.P. Kuala Lumpur 131 barang −10.8% vs national THE STORE ( M3 MALL TMN MELATI ) Wangsa Maju·W.P. Kuala Lumpur 148 barang −13.1% vs national
Branches selling items below the national average, sorted by the widest gap.
THE STORE tracks 199 items at 10 locations across 5 states for the week of 2 November 2026. On average its prices are 8.3% higher than the national average.
Cheapest in Johor (+0.9% vs national); most expensive in W.p. Kuala Lumpur (+11.0%).
Main groups: Packaged Goods (79), Fresh Produce (63), Hygiene Products (16).
By Category Group
% Difference from the National Average — State × Category Group
| Johor | +2.2% | −5.2% | +13% | +3% | +3.7% | −9.6% |
|---|---|---|---|---|---|---|
| Pahang | +0.8% | +2.8% | +10% | +0.9% | +5.6% | +14% |
| Perak | +1.4% | +4.5% | +11% | +5.3% | +6% | +21% |
| Perlis | 0% | +14% | +0.5% | +5.2% | +4.9% | +20% |
| W.P. Kuala Lumpur | −0.1% | +26% | +10% | +5% | +8% | +10% |
Each cell: the average percentage difference of every item in that group in that state against the national price for the same item.
vs National is computed as the average percentage difference of each item against the national average, so it is not skewed by differing item mixes. Each matrix cell: the average difference of items in that group in that state against the national price.