WLS ENTERPRISE
Price coverage of 74 items at 11 locations across 1 states.
Item List

okra
RM 14.00 /1kg SAYUR-SAYURAN
kai-lan (Chinese broccoli)
RM 7.90 /1kg SAYUR-SAYURAN
carrot
RM 2.62 /1kg SAYUR-SAYURAN
lime
RM 5.10 /1kg BUAH-BUAHAN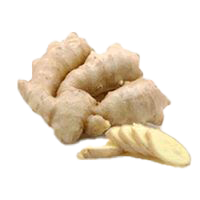
fresh ginger (old)
RM 6.50 /1kg SAYUR-SAYURAN
green chilli (akar variety)
RM 9.85 /1kg SAYUR-SAYURAN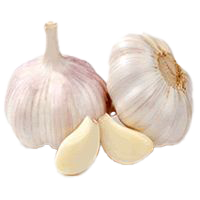
imported garlic (China)
RM 11.80 /1kg BAWANG
broccoli
RM 8.99 /1kg SAYUR-SAYURAN
fresh yellow noodles (various brands)
RM 1.40 /+-450g MEE/KUETIAU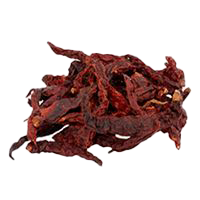
dried curly chilli (with/without stalk)
RM 26.73 /1kg CILI KERING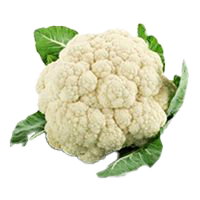
cauliflower
RM 7.12 /1kg SAYUR-SAYURAN
green chilli
RM 12.35 /1kg SAYUR-SAYURANBy State
Sorted from cheapest to priciest against the national average
Biggest Savings — WLS ENTERPRISE
 WLS ENTERPRISE SDN. BHD (MELOR) Kota Bharu·Kelantan 66 barang −0.8% vs national WLS ENTERPRISE SDN BHD (SUNGAI KELADI) Kota Bharu·Kelantan 68 barang −0.8% vs national WLS ENTERPRISE SDN BHD - KOK LANAS Kota Bharu·Kelantan 48 barang −1.7% vs national WLS ENTERPRISE SDN BHD- SERING Kota Bharu·Kelantan 46 barang −1.8% vs national WLS ENTERPRISE SDN BHD- KOTA JEMBAL Kota Bharu·Kelantan 48 barang −1.8% vs national WLS ENTERPRISE SDN BHD - SEKEBUN BUNGA Kota Bharu·Kelantan 53 barang −1.9% vs national WLS ENTERPRISE SDN BHD - TUMPAT Tumpat·Kelantan 44 barang −2.2% vs national WLS ENTERPRISE SDN BHD - TELAGA BATA TUMPAT Tumpat·Kelantan 49 barang −2.3% vs national WLS ENTERPRISE SDN BHD KUBANG KERIAN Kota Bharu·Kelantan 47 barang −2.6% vs national WLS ENTERPRISE SDN BHD - PANJI Kota Bharu·Kelantan 46 barang −2.6% vs national
Branches selling items below the national average, sorted by the widest gap.
WLS ENTERPRISE tracks 74 items at 11 locations across 1 states for the week of 2 November 2026. On average its prices are on par with the national average.
Cheapest in Kelantan (+0.2% vs national).
Main groups: Packaged Goods (39), Fresh Produce (23), Milk and Baby Products (9).
By Category Group
% Difference from the National Average — State × Category Group
| Kelantan | +1.9% | −5.7% | +2.2% | +17% |
|---|
Each cell: the average percentage difference of every item in that group in that state against the national price for the same item.
vs National is computed as the average percentage difference of each item against the national average, so it is not skewed by differing item mixes. Each matrix cell: the average difference of items in that group in that state against the national price.