Squid
Weekly trend and coverage of 1 items across 16 states.
Item List
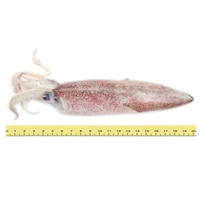
Best Value for Squid
 BATARAS SUPERSTORE (KOTA MARUDU) Kota Marudu·Sabah 1 barang −59.5% vs kebangsaan PASAR AM KUDAT Kudat·Sabah 1 barang −57.5% vs kebangsaan PASAR INANAM Kota Kinabalu·Sabah 1 barang −53.6% vs kebangsaan BATARAS SUPERSTORE Kota Kinabalu·Sabah 1 barang −51.8% vs kebangsaan
 NEW WORLD MART (MIRI) SDN BHD Miri·Sarawak 1 barang −51.0% vs kebangsaan PASAR BESAR IKAN TAWAU Tawau·Sabah 1 barang −50.8% vs kebangsaan PASAR SENTRAL LABUAN Kawasan Bandar·W.P. Labuan 1 barang −49.8% vs kebangsaan GAFU SUPERMARKET (MUKAH) Mukah·Sarawak 1 barang −49.3% vs kebangsaan
 EVERWIN SUPERMARKET (MUKAH) Mukah·Sarawak 1 barang −48.4% vs kebangsaan PASAR BASAH TUARAN Tuaran·Sabah 1 barang −47.9% vs kebangsaan
Stores selling this subcategory’s items below the national average, sorted by the largest gap.
Latest Squid prices in Malaysia, in the Seafood category (Fresh Produce): 1 items tracked across 16 states for the week of 9 November 2026. W.P. Labuan has the lowest prices (−49.8% vs national).
Weekly trend: subcategory prices are almost unchanged this week.
Cheapest in W.P. Labuan (−49.8% vs national); most expensive in W.P. Putrajaya (+22.8%).
The widest cross-state price gap is on squid (>=6 per kg): 144.6% (cheapest W.P. Labuan, most expensive W.P. Putrajaya).
Weekly Trend — State × Item
| Johor | +1.9% |
|---|---|
| Kedah | +0.6% |
| Kelantan | −0.2% |
| Melaka | +3.5% |
| Negeri Sembilan | −0.6% |
| Pahang | +0.7% |
| Perak | +0.3% |
| Perlis | −0.3% |
| Pulau Pinang | +2.2% |
| Sabah | −1.9% |
| Sarawak | −1.7% |
| Selangor | +0.2% |
| Terengganu | +1.9% |
| W.P. Kuala Lumpur | −1.7% |
| W.P. Labuan | +8.3% |
| W.P. Putrajaya | −2.7% |
Each cell: the change in that item’s average price in that state versus last week. Green = down, red = up.
% Difference from National Average — State × Item
| Johor | +7.9% |
|---|---|
| Kedah | −2% |
| Kelantan | −4% |
| Melaka | +7.2% |
| Negeri Sembilan | +0.6% |
| Pahang | +9.1% |
| Perak | −2.8% |
| Perlis | −1.9% |
| Pulau Pinang | +2.2% |
| Sabah | −43% |
| Sarawak | −18% |
| Selangor | +0.6% |
| Terengganu | +3% |
| W.P. Kuala Lumpur | +14% |
| W.P. Labuan | −50% |
| W.P. Putrajaya | +23% |
Each cell: the percentage difference of that item’s price in that state versus the national price. Green = lower, red = higher.
% Difference from National Average — Store Type × Item
| Grocery Store | −23% |
|---|---|
| Hypermarket | −0.7% |
| Minimart | +6.8% |
| Supermarket | +2.3% |
| Wet Market | −4.1% |
Each cell: the percentage difference of that item’s price at that store type versus the national price. Store types with the most locations are listed first.
vs National is computed as the average per-item percentage difference, so it is not skewed by the differing mix of items across states or store types. The matrix above shows the 8 cheapest items in this subcategory.