Carbonated Water
Weekly trend and coverage of 8 items across 16 states.
Item List
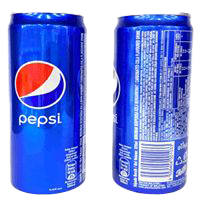
Pepsi Cola (tin)
RM 1.83 /320 ml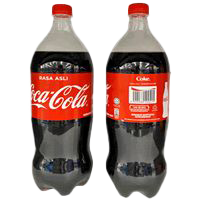
Coca-Cola (bottle)
RM 3.89 /1.5 liter ▲ RM 0.05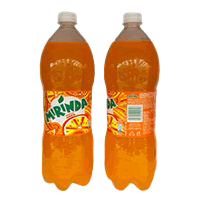
Mirinda orange (bottle)
RM 3.02 /1.5 liter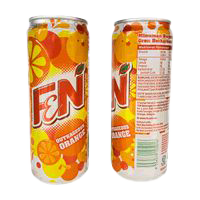
F&N orange (tin)
RM 1.77 /325 ml ▼ RM 0.02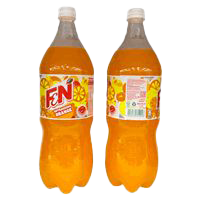
F&N orange (bottle)
RM 3.45 /1.5 liter ▲ RM 0.03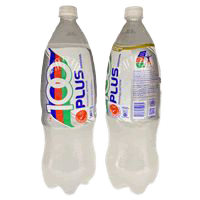
100 Plus (original)
RM 3.78 /1.5 liter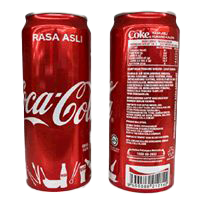
Coca-Cola (tin)
RM 1.95 /320 ml ▲ RM 0.01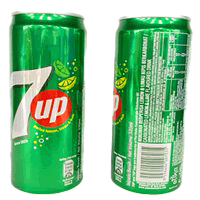
Seven Up Lemon & Lime (tin)
RM 1.84 /320mlBest Value for Carbonated Water
 LOTUS'S BUKIT TINGGI Klang·Selangor 5 barang −19.8% vs kebangsaan LOTUSS STORE (TESCO MERGONG) Kota Setar·Kedah 5 barang −18.8% vs kebangsaan LOTUS'S SEKSYEN 13 Petaling·Selangor 5 barang −18.2% vs kebangsaan LOTUSS (TESCO SG. PETANI SELATAN) Kuala Muda·Kedah 5 barang −17.4% vs kebangsaan LOTUS'S BERTAM PERDANA Seberang Perai Utara·Pulau Pinang 6 barang −17.3% vs kebangsaan
 ECONSAVE PORT DICKSON Port Dickson·Negeri Sembilan 6 barang −17.1% vs kebangsaan PASARAYA ECONSAVE BAKRI MUAR Muar·Johor 6 barang −16.4% vs kebangsaan ECONSAVE PAYA TERUBONG Timur Laut·Pulau Pinang 6 barang −16.2% vs kebangsaan ECONSAVE KOTA KEMUNING Petaling·Selangor 6 barang −16.1% vs kebangsaan ECONSAVE CASH & CARRY RAJA UDA Seberang Perai Utara·Pulau Pinang 6 barang −16.1% vs kebangsaan
Stores selling this subcategory’s items below the national average, sorted by the largest gap.
Latest Carbonated Water prices in Malaysia, in the Ready-to-Drink category (Beverages): 8 items tracked across 16 states for the week of 2 November 2026. Melaka has the lowest prices (−6.5% vs national).
Weekly trend: subcategory prices are almost unchanged this week.
Cheapest in Melaka (−6.5% vs national); most expensive in W.P. Putrajaya (+6.4%).
The widest cross-state price gap is on Pepsi Cola (tin): 46.7% (cheapest Perak, most expensive Perlis).
Weekly Trend — State × Item
| Johor | +0.1% | +0.1% | +0.1% | +0.2% | +1.8% | +0.4% | +2.1% | +0.3% |
|---|---|---|---|---|---|---|---|---|
| Kedah | −0.1% | 0% | 0% | 0% | +13% | −0.9% | +0.9% | −0.1% |
| Kelantan | +0.1% | 0% | 0% | 0% | +2.2% | −2.1% | −0.6% | +4% |
| Melaka | −1.9% | 0% | 0% | 0% | 0% | −6.4% | −1.3% | −2.4% |
| Negeri Sembilan | 0% | 0% | 0% | −3.5% | −1.6% | −2.4% | −0.1% | −1.7% |
| Pahang | +0.9% | +0.3% | 0% | −0.9% | −0.3% | +2.1% | +0.5% | +0.3% |
| Perak | +1.3% | −0.6% | +0.2% | +0.4% | +1.7% | −0.4% | +1.4% | −2.3% |
| Perlis | 0% | 0% | 0% | +14% | 0% | +2.4% | ||
| Pulau Pinang | +0.9% | 0% | +0.8% | +0.5% | −3.3% | −3% | +4.3% | +1.5% |
| Sabah | −0.1% | +0.3% | +0.3% | 0% | 0% | −0.1% | −0.4% | −1.7% |
| Sarawak | −0.2% | +0.4% | +0.4% | −0.1% | +0.8% | 0% | +0.2% | +0.3% |
| Selangor | 0% | 0% | 0% | 0% | 0% | 0% | 0% | |
| Terengganu | 0% | 0% | 0% | −1% | +1.3% | +0.1% | +1% | +0.5% |
| W.P. Kuala Lumpur | +0.1% | +0.1% | +0.4% | −0.1% | +1.5% | −2.2% | +0.9% | −0.2% |
| W.P. Labuan | 0% | 0% | +1.5% | 0% | 0% | 0% | −2.8% | |
| W.P. Putrajaya | 0% | 0% | 0% | −0.6% | +1.6% | −1% | +4.6% | +3.6% |
Each cell: the change in that item’s average price in that state versus last week. Green = down, red = up.
% Difference from National Average — State × Item
| Johor | +2.9% | −2.2% | −3.3% | −0.1% | −1% | −5% | −4% | −1.5% |
|---|---|---|---|---|---|---|---|---|
| Kedah | −4.3% | −4.9% | −3.3% | −0.8% | −5.3% | −12% | −7.8% | −12% |
| Kelantan | −2.9% | +3.6% | +1.8% | +2.5% | −2.2% | −1.5% | −0.1% | +1.8% |
| Melaka | +2.9% | −5.9% | −6.7% | −6.5% | −14% | −13% | −4.1% | −5.1% |
| Negeri Sembilan | +0.4% | −0.2% | +1.8% | −4.8% | −9.4% | −14% | −10% | −3.9% |
| Pahang | −0.3% | −1.3% | −0.3% | +1.2% | −2% | +7.4% | +4.9% | +8.3% |
| Perak | −1.5% | −7.1% | −7.4% | −4.7% | −8.9% | −10% | −3.8% | −5.3% |
| Perlis | +3.2% | +36% | +12% | −6.7% | −13% | −2.7% | −20% | |
| Pulau Pinang | +4.9% | −4.3% | +2.2% | −1.5% | −11% | −9.6% | −6.2% | −11% |
| Sabah | −4.8% | −2.7% | −2.7% | −1% | +7.6% | +8.8% | +8.3% | +4.4% |
| Sarawak | −3.1% | −0.5% | −0.7% | −1.7% | +4.7% | +9.1% | +6.8% | +1.3% |
| Selangor | +5.4% | 0% | −0.6% | −0.5% | −6.1% | −9.4% | −5.5% | −7.5% |
| Terengganu | −1.2% | +7.5% | +6.8% | +5.6% | +1.2% | +0.1% | +0.9% | +5.4% |
| W.P. Kuala Lumpur | +3% | +6.3% | +6.2% | +4.5% | +12% | +2.2% | +1.6% | +5% |
| W.P. Labuan | +2.1% | +1.2% | −0.7% | +2.5% | +10% | +11% | +3.3% | |
| W.P. Putrajaya | +22% | +5.2% | +5.7% | +5.5% | +9.8% | 0% | +2% | +0.4% |
Each cell: the percentage difference of that item’s price in that state versus the national price. Green = lower, red = higher.
% Difference from National Average — Store Type × Item
| Grocery Store | +3.5% | +3.4% | +0.8% | +25% | +6.5% | −2.2% | ||
|---|---|---|---|---|---|---|---|---|
| Hypermarket | +7.7% | +1.9% | +2.6% | +0.9% | −8.1% | −6.8% | −5.4% | −12% |
| Minimart | −1.5% | +3% | +0.6% | −3.3% | +8% | +7.6% | +4% | +3.2% |
| Supermarket | −1.3% | −0.5% | −0.5% | −0.1% | +1.9% | +1.8% | +1.2% | +3.5% |
Each cell: the percentage difference of that item’s price at that store type versus the national price. Store types with the most locations are listed first.
vs National is computed as the average per-item percentage difference, so it is not skewed by the differing mix of items across states or store types. The matrix above shows the 8 cheapest items in this subcategory.